
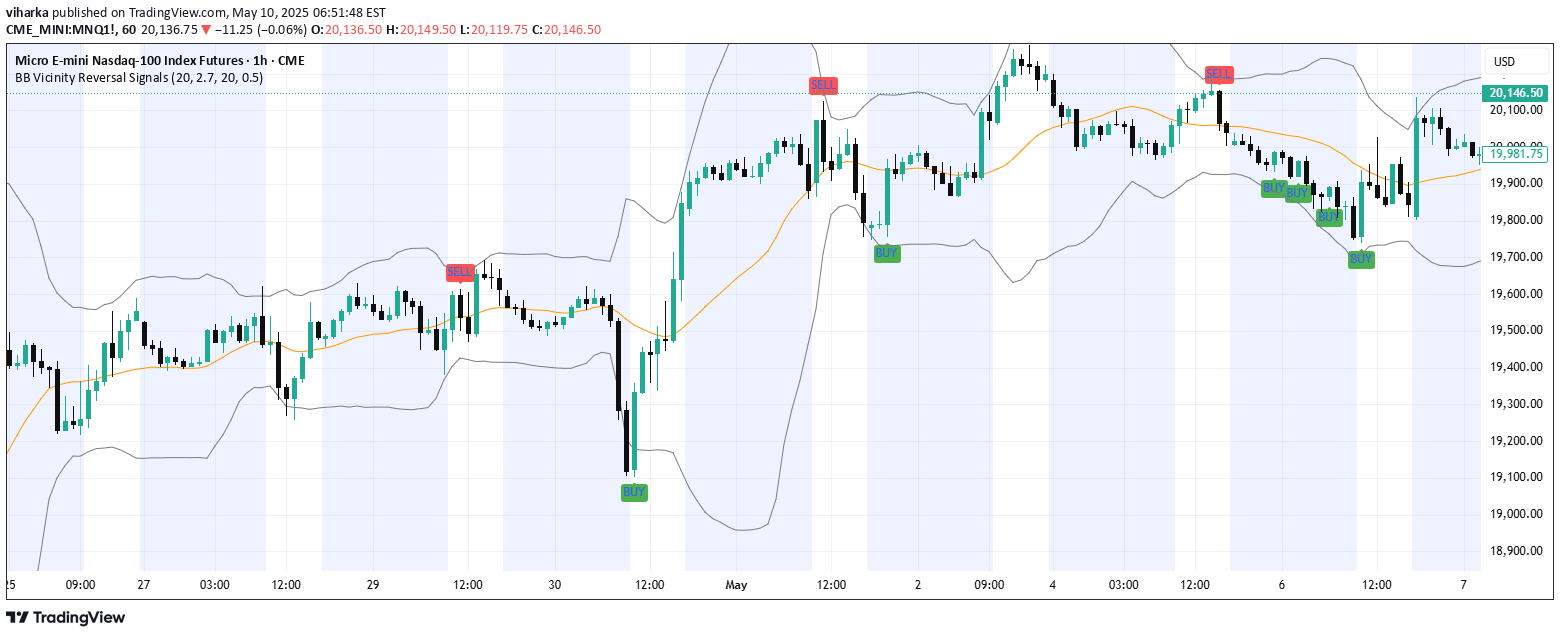
An intraday reversal indicator using Bollinger Bands that identifies potential mean-reversion trading opportunities by analyzing price action near outer band boundaries.
Explore complementary indicator rolesHow it works
The indicator utilizes Bollinger Bands set at ±2.7 standard deviations to identify potential price reversal zones. It generates buy signals when a strong bullish candle forms near the lower band and sell signals when a strong bearish candle forms near the upper band.
The tool incorporates a user-adjustable vicinity percentage (default 20%) to define the acceptable proximity to band boundaries. It also applies a body-to-candle ratio filter to ensure only meaningful directional candles trigger signals, enhancing the precision of potential trade entry points.
Why it may be useful
Traders benefit from this indicator's ability to capture high-probability mean-reversion opportunities with increased signal frequency and logical precision. By focusing on price action near Bollinger Band extremes, the tool helps identify potential trend reversals before they fully develop.
The flexible design allows traders to adapt the indicator to different market conditions and trading styles. Its built-in alerts and real-time signal generation provide traders with timely information to make informed trading decisions without the risk of repainting.
When to explore it
This indicator is most effective on intraday timeframes such as 5-minute, 15-minute, and 1-hour charts where mean-reversion strategies tend to perform well. It works particularly well in range-bound or consolidating markets where price tends to oscillate between support and resistance levels.
Traders should consider using this tool in markets with moderate volatility, where price movements are predictable enough to generate reliable signals. It is especially useful for traders seeking a systematic approach to identifying potential entry points with a focus on capturing short-term price reversals.
Keep exploring
What we’ve verified
Access, alerts and repainting behaviour have not been independently verified for this indicator. Check the creator’s current publication and settings.
General descriptions and classifications are recovered research. Verified details above identify the specific checks we have completed. Check the creator’s current publication for later changes.


