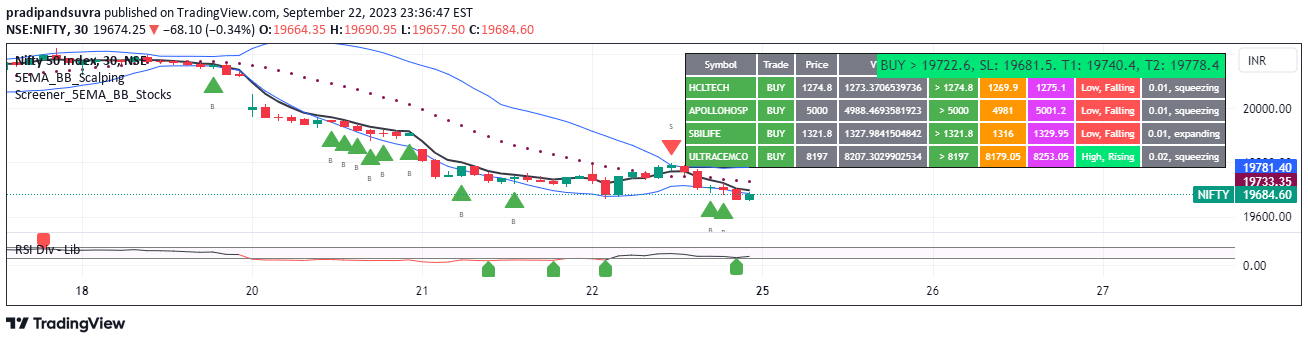
A dynamic trading scanner that identifies potential buy and sell signals for Nifty-50 stocks using 5-EMA and Bollinger Bands, providing real-time trade recommendations.
Explore complementary indicator rolesHow it works
The 5-EMA strategy works by tracking price divergence from the 5-period Exponential Moving Average and analyzing its relationship with Bollinger Bands. When the price moves away from the 5-EMA, the strategy anticipates a correction back to the mean, creating potential trading opportunities.
The scanner systematically checks each Nifty-50 stock by comparing the candle's high and low with the 5-EMA and verifying its position within the Bollinger Bands. It generates buy and sell signals based on specific price and band conditions, while simultaneously tracking volume and volatility metrics.
Why it may be useful
This scanner simplifies the complex process of manually screening multiple stocks by automatically identifying trading opportunities across Nifty-50 constituents. It eliminates the need for traders to individually analyze each stock, providing a streamlined approach to identifying potential trade setups.
By incorporating multiple technical indicators like 5-EMA, Bollinger Bands, volume, and VWAP, the scanner offers a comprehensive view of market conditions. This multi-dimensional analysis helps traders make more informed decisions by providing context beyond simple price movement.
When to explore it
The scanner is most effective when used on 30-minute timeframes, which provide a balanced view of short-term market dynamics without overwhelming computational resources. It works best during periods of moderate market volatility where mean reversion strategies are more likely to yield consistent results.
Traders should use this scanner as a screening tool rather than a standalone trading system, employing additional confirmation signals and risk management techniques. It is particularly useful for identifying potential trade opportunities in Nifty-50 stocks during active trading sessions.
Keep exploring
What we’ve verified
Access, alerts and repainting behaviour have not been independently verified for this indicator. Check the creator’s current publication and settings.
General descriptions and classifications are recovered research. Verified details above identify the specific checks we have completed. Check the creator’s current publication for later changes.