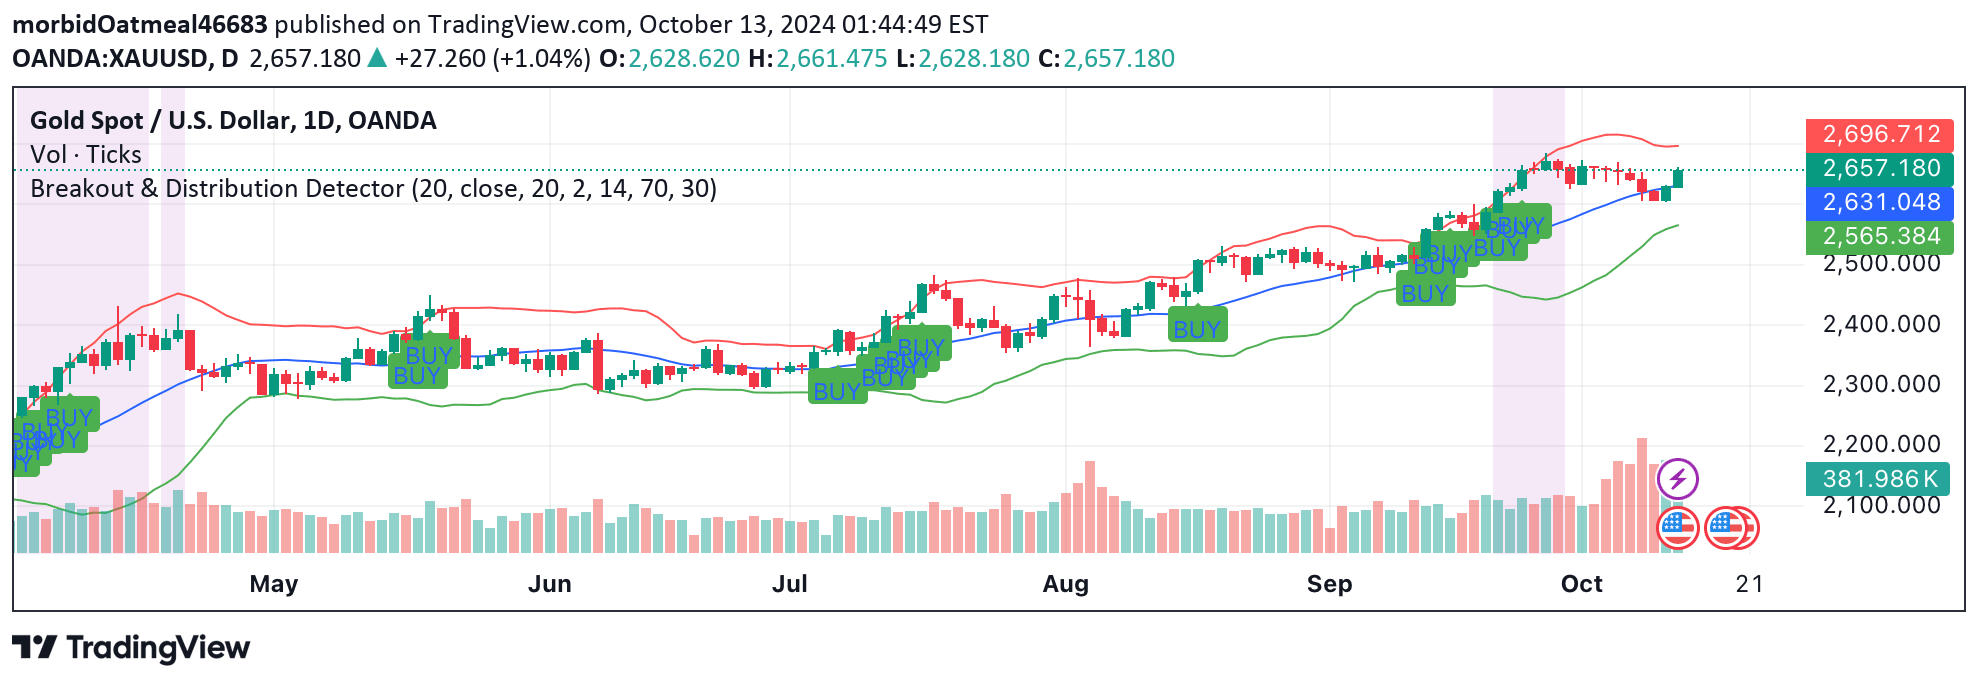
A trading signal that combines Bollinger Bands, RSI, and moving average to detect potential market breakouts and momentum shifts across different trading scenarios.
Explore complementary indicator rolesHow it works
The signal uses Bollinger Bands to detect price volatility and potential breakouts by monitoring price movements relative to upper and lower bands. When price closes above the upper band, it indicates a bullish breakout, while closing below the lower band suggests a bearish breakout.
The system further validates these breakouts using the RSI for momentum confirmation and a 20-period simple moving average to ensure trading in the trend's direction. This multi-indicator approach helps filter out false signals and provides more robust entry and exit points for traders.
Why it may be useful
By combining multiple technical indicators, this signal offers traders a comprehensive approach to identifying potential market movements with increased accuracy and confidence. The integrated analysis helps reduce the likelihood of false signals and provides a more nuanced understanding of market dynamics.
The signal's ability to detect breakouts, confirm momentum, and consider trend direction makes it a valuable tool for traders seeking to make more informed decisions. It helps traders recognize potential trend reversals, continuation patterns, and market transitions across different timeframes.
When to explore it
This signal is most effective in markets with clear trending characteristics and moderate volatility, where price movements are distinct and momentum is measurable. It works particularly well in liquid markets like forex, major stock indices, and prominent cryptocurrencies where technical indicators can provide meaningful insights.
Traders should apply this signal during periods of consistent price action and avoid using it during extreme market conditions, such as major news events or significant economic announcements that can cause unpredictable price swings.
Keep exploring
What we’ve verified
Access, alerts and repainting behaviour have not been independently verified for this indicator. Check the creator’s current publication and settings.
General descriptions and classifications are recovered research. Verified details above identify the specific checks we have completed. Check the creator’s current publication for later changes.