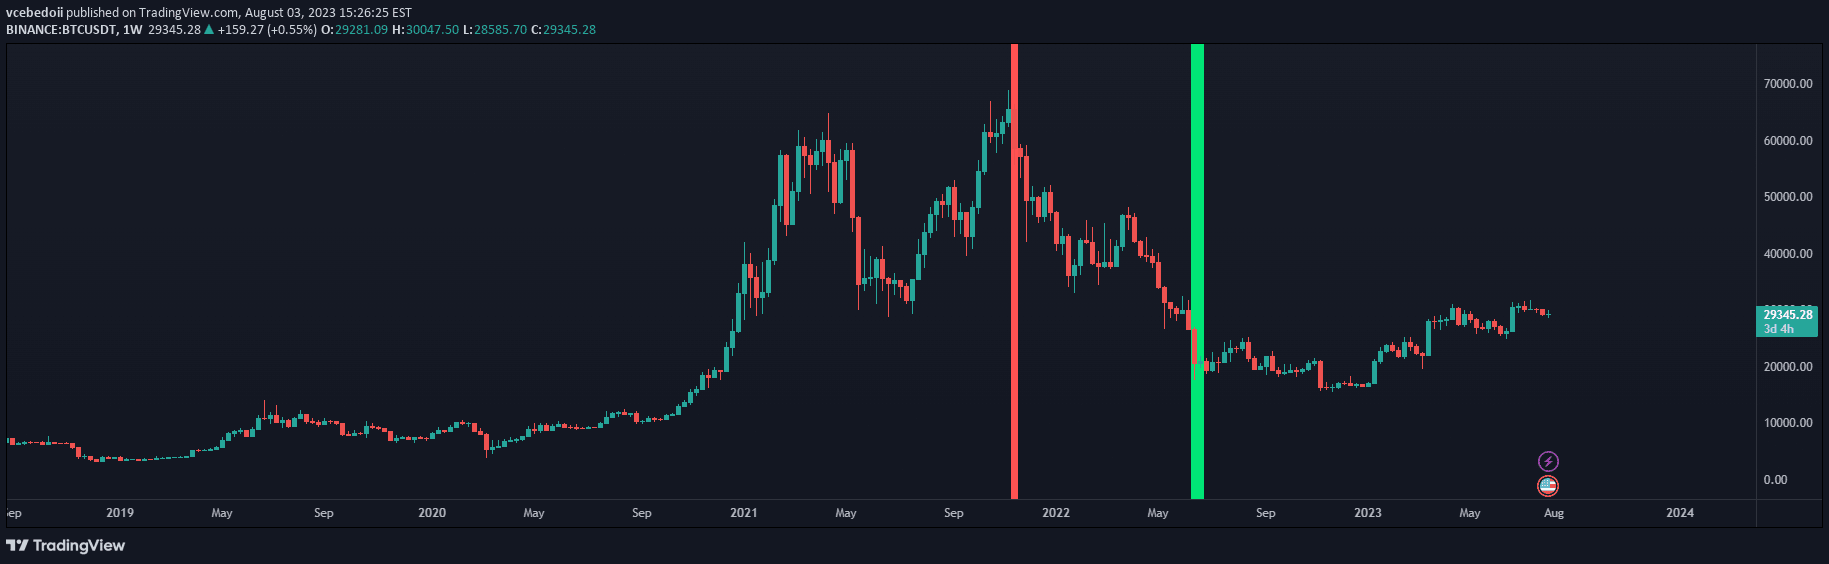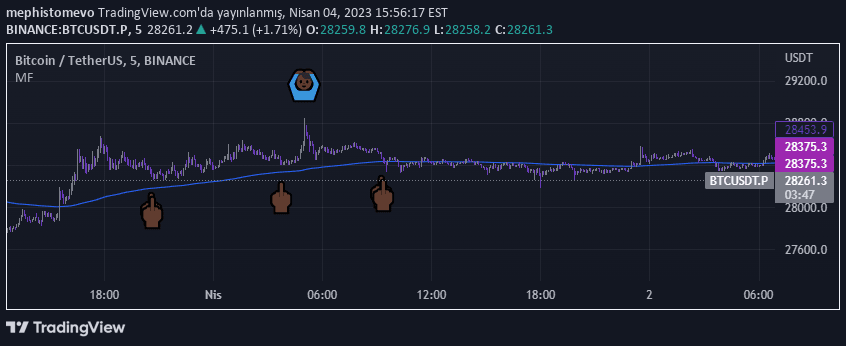
A multi-indicator trading strategy using EMA, MACD, Bollinger Bands, and RSI to generate precise market entry and exit signals based on trend, momentum, and price conditions.
Explore complementary indicator rolesHow it works
The 'God's Little Finger' indicator integrates multiple technical analysis tools to assess market conditions comprehensively. It uses a 200-period exponential moving average to determine the primary trend direction, while MACD measures trend momentum and speed.
The indicator simultaneously evaluates price positions relative to Bollinger Bands and checks RSI levels to confirm potential trading signals. Buy and sell decisions are generated when specific conditions across these indicators align, providing a multi-layered approach to market analysis.
Why it may be useful
This indicator is crucial because it combines multiple technical analysis tools to reduce false signal risks and enhance trading decision accuracy. By integrating trend, momentum, volatility, and oscillator indicators, traders can gain a more holistic view of market conditions.
The comprehensive approach helps traders identify high-probability trade setups by cross-referencing different technical indicators, potentially improving entry and exit timing while providing a more robust trading strategy.
When to explore it
The indicator works best in markets with clear trending characteristics and moderate volatility, where multiple technical indicators can provide consistent signals. It is particularly effective in liquid markets like forex, stocks, and major cryptocurrency pairs where price movements are more predictable.
Traders should use this indicator during stable market conditions and avoid using it during extreme market events, news releases, or periods of high uncertainty where traditional technical analysis might become less reliable.
Keep exploring
What we’ve verified
Access, alerts and repainting behaviour have not been independently verified for this indicator. Check the creator’s current publication and settings.
General descriptions and classifications are recovered research. Verified details above identify the specific checks we have completed. Check the creator’s current publication for later changes.