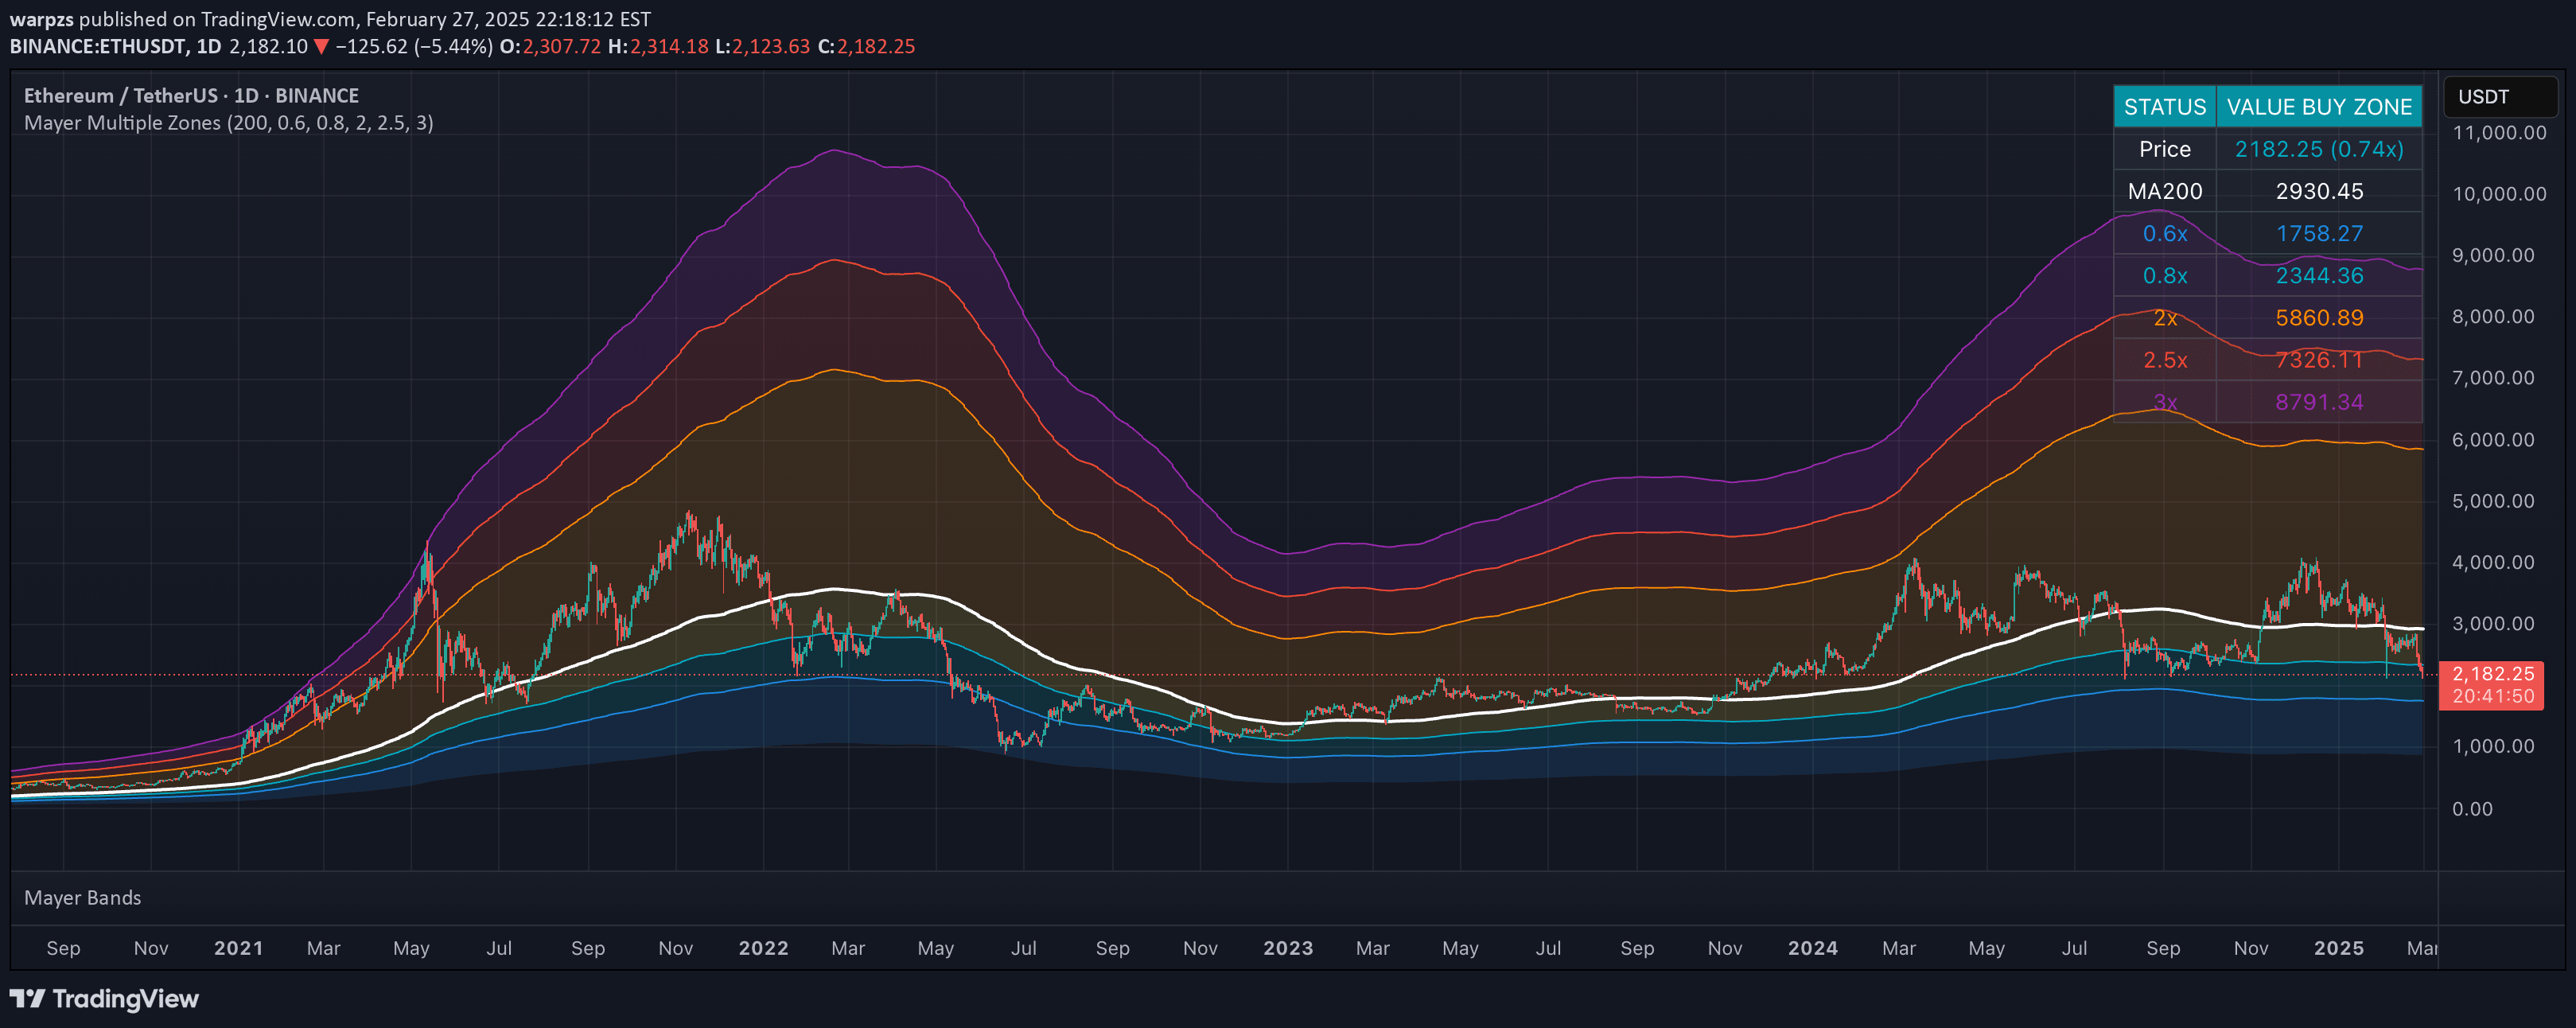
An advanced crypto valuation indicator that identifies price zones relative to MA200 and provides market context through ETH/BTC ratio analysis for strategic trading decisions.
Explore complementary indicator rolesHow it works
The Enhanced Mayer Multiple Zones indicator generates six distinct price zones based on multiples of the 200-day moving average, ranging from strong buy to bubble zones. Each zone is color-coded and dynamically adjusts its intensity based on current market conditions and the ETH/BTC ratio context.
The indicator calculates these zones using predefined thresholds (0.6x, 0.8x, 2.0x, 2.5x, 3.0x) around the MA200, creating a comprehensive visual representation of price positioning. Traders can customize the multiple thresholds and toggle ETH/BTC context analysis to suit their specific trading strategy.
Why it may be useful
The Enhanced Mayer Multiple Zones provides traders with a sophisticated, multi-dimensional view of market valuation beyond traditional price analysis. By incorporating both historical price movement and cross-asset context, the indicator offers a more nuanced understanding of potential entry and exit points.
This approach reduces emotional trading decisions by providing a structured, data-driven framework for assessing market conditions. The color-coded zones and opacity signals make complex market dynamics more accessible, allowing traders to quickly identify strong buying opportunities or potential market tops.
When to explore it
The Enhanced Mayer Multiple Zones is most effective in volatile cryptocurrency markets with sufficient price history, particularly for assets like ETH, SOL, and AAVE. It works best when traders want a comprehensive view of price positioning relative to long-term moving averages and need additional market context.
The indicator is particularly valuable during market transitions, helping traders identify potential trend reversals, undervalued zones, and overbought conditions. It is most reliable when used in conjunction with other technical analysis tools and a broader understanding of market dynamics.
Keep exploring
What we’ve verified
Access, alerts and repainting behaviour have not been independently verified for this indicator. Check the creator’s current publication and settings.
General descriptions and classifications are recovered research. Verified details above identify the specific checks we have completed. Check the creator’s current publication for later changes.