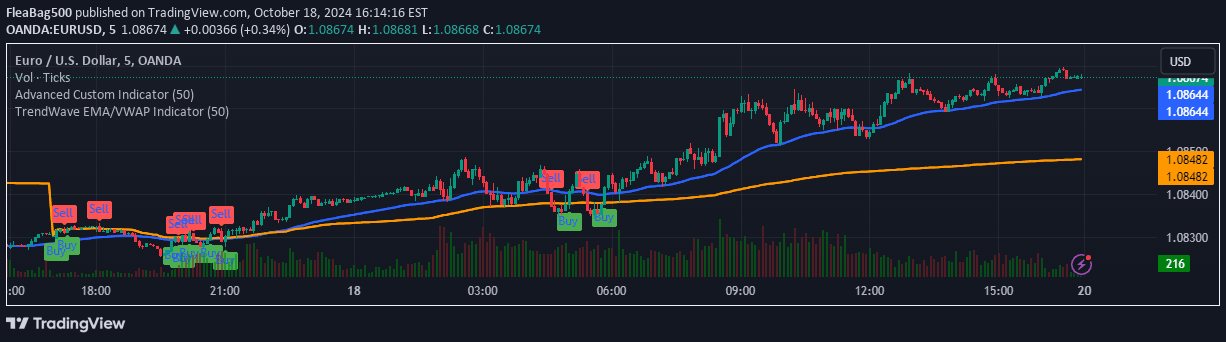
A trendline-based trading indicator that draws pivot point trendlines and uses GMMA arrows to confirm trend direction, helping traders identify potential entry and exit points.
Explore complementary indicator rolesHow it works
The indicator automatically identifies pivot points on the price chart and draws primary and secondary trendlines based on these points. It uses color-coded candles to highlight trendline breaks, with primary trendline breaks displaying both candle color changes and break symbols as labels.
Additionally, the indicator incorporates Guppy Multiple Moving Averages (GMMA) arrows to provide trend confirmation. These arrows help traders understand the potential trend direction by generating visual signals that complement the trendline analysis.
Why it may be useful
Trendline analysis is crucial for traders as it provides a visual representation of market momentum and potential trend reversals. By identifying key pivot points and drawing dynamic trendlines, traders can gain insights into market structure and potential support and resistance levels.
The integration of GMMA arrows adds an extra layer of trend confirmation, helping traders make more informed decisions by combining multiple technical analysis techniques. This approach reduces the likelihood of false signals and provides a more comprehensive view of market dynamics.
When to explore it
This indicator is most effective in trending markets where clear directional movements are present. Traders should use it in conjunction with other technical analysis tools and confirm signals across multiple timeframes to increase reliability.
It is particularly useful for day and swing traders who want to identify potential entry and exit points based on trendline breaks and trend confirmation. However, traders should always complement this indicator with their own price action analysis and risk management strategies.
Keep exploring
What we’ve verified
Access, alerts and repainting behaviour have not been independently verified for this indicator. Check the creator’s current publication and settings.
General descriptions and classifications are recovered research. Verified details above identify the specific checks we have completed. Check the creator’s current publication for later changes.