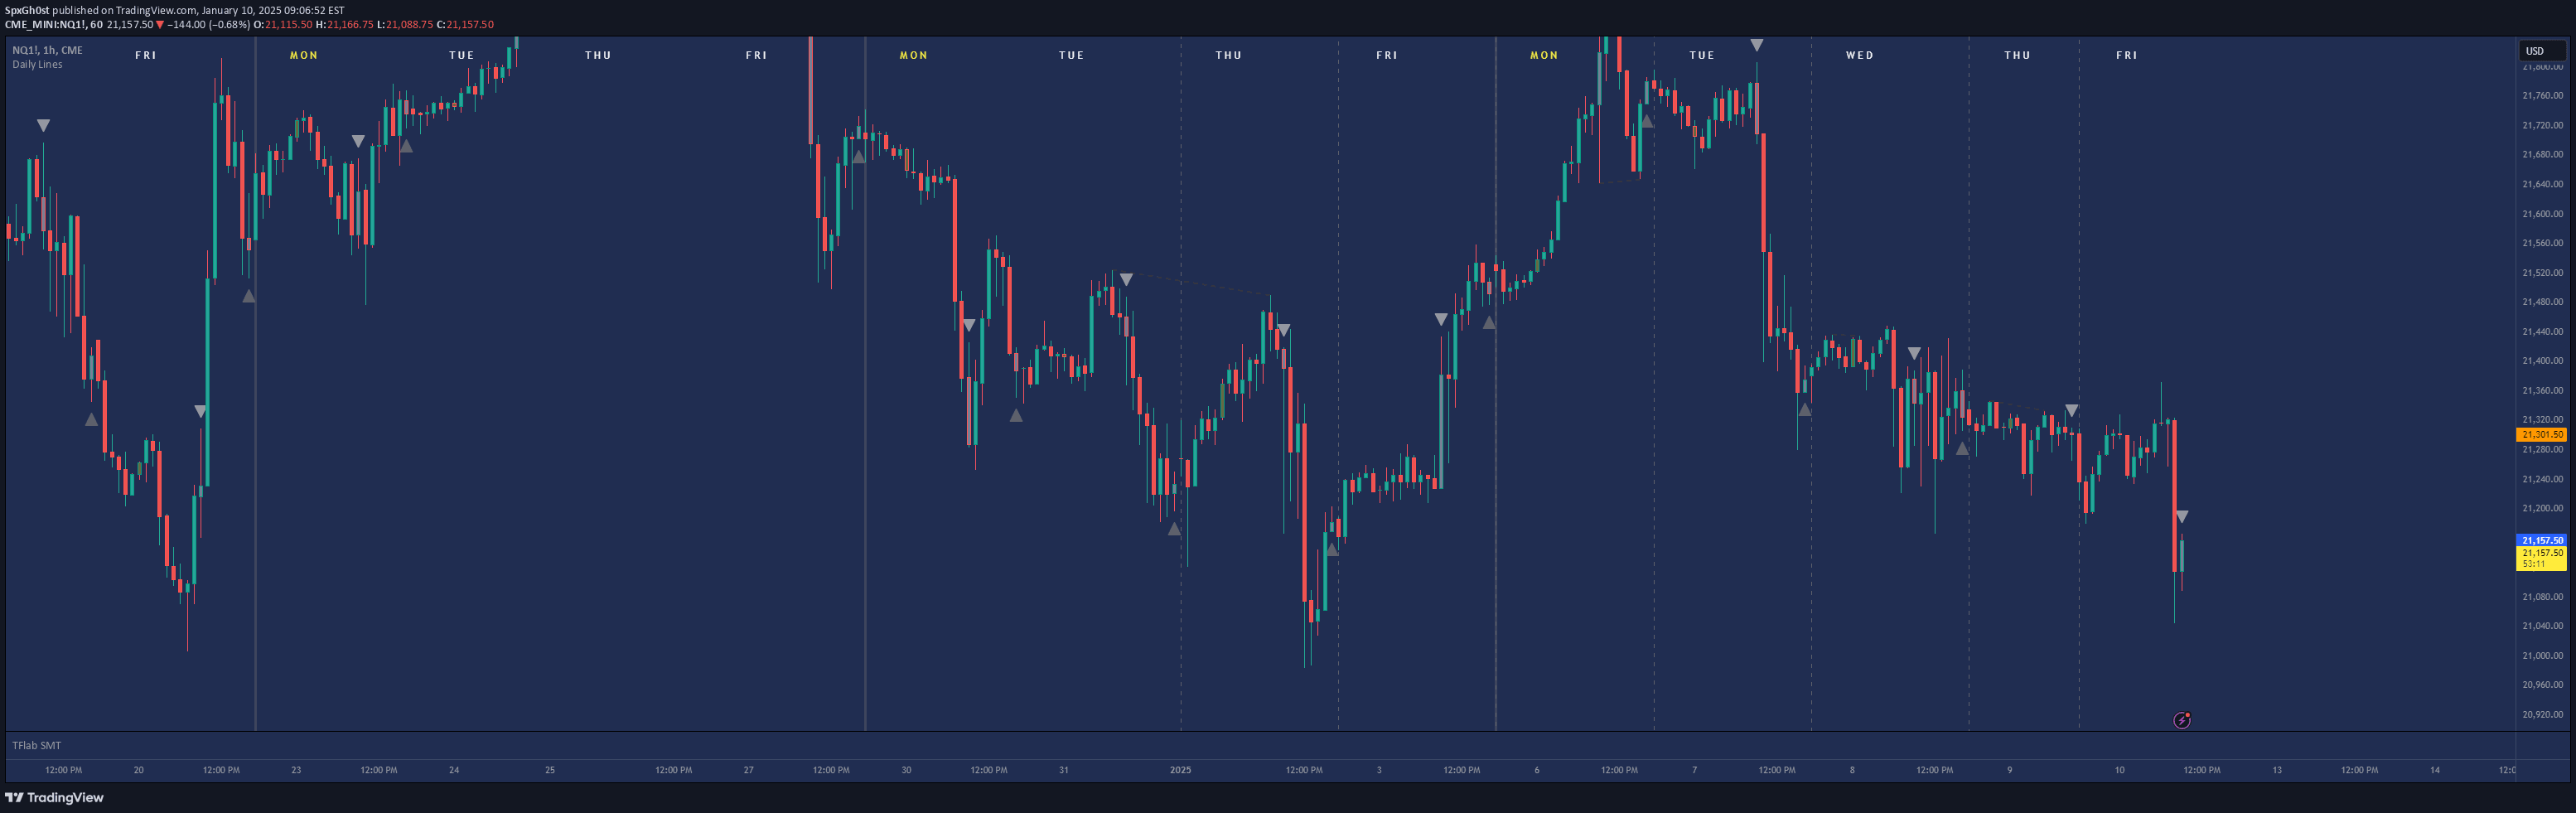
A dynamic weekly open price indicator that marks the first candle's opening price as a reference line for understanding market direction and potential trading opportunities within the current week.
Explore complementary indicator rolesHow it works
The weekly open indicator automatically captures the opening price of the first candle in a new trading week and draws a horizontal line across the chart. This line remains constant throughout the current week, providing traders with a clear visual reference point for market dynamics and potential price interactions.
As each new week begins, the indicator recalculates and resets the line to reflect the new weekly open price. Traders can easily observe how current price action relates to this key level, using it as a benchmark for understanding market sentiment and potential directional movements.
Why it may be useful
The weekly open serves as a critical reference point for understanding market structure and directional bias according to ICT trading methodologies. By providing a clear visual anchor, traders can quickly assess whether the current price is trading above or below the weekly open, which offers immediate insights into potential bullish or bearish market conditions.
This indicator helps traders make more informed decisions by contextualizing price action within the broader weekly framework. It allows for strategic entry and exit points, risk management, and alignment with higher timeframe market dynamics.
When to explore it
The weekly open indicator is most effective during the first few days of a trading week when price is likely to interact with or respect this key level. Traders can use it to identify potential mean reversion opportunities, especially during Monday and Tuesday trading sessions when market volatility and directional shifts are more pronounced.
It works particularly well when combined with other ICT trading concepts like optimal trade entry (OTE) and Judas Swings. Traders should pay special attention to how price behaves around the weekly open, using it to confirm trend direction, potential reversals, and to structure stop-loss or take-profit levels.
Keep exploring
What we’ve verified
Access, alerts and repainting behaviour have not been independently verified for this indicator. Check the creator’s current publication and settings.
General descriptions and classifications are recovered research. Verified details above identify the specific checks we have completed. Check the creator’s current publication for later changes.