A TradingView indicator that highlights daily market sessions, opening prices, and key trading times with customizable vertical lines and markers for traders.
Explore complementary indicator rolesHow it works
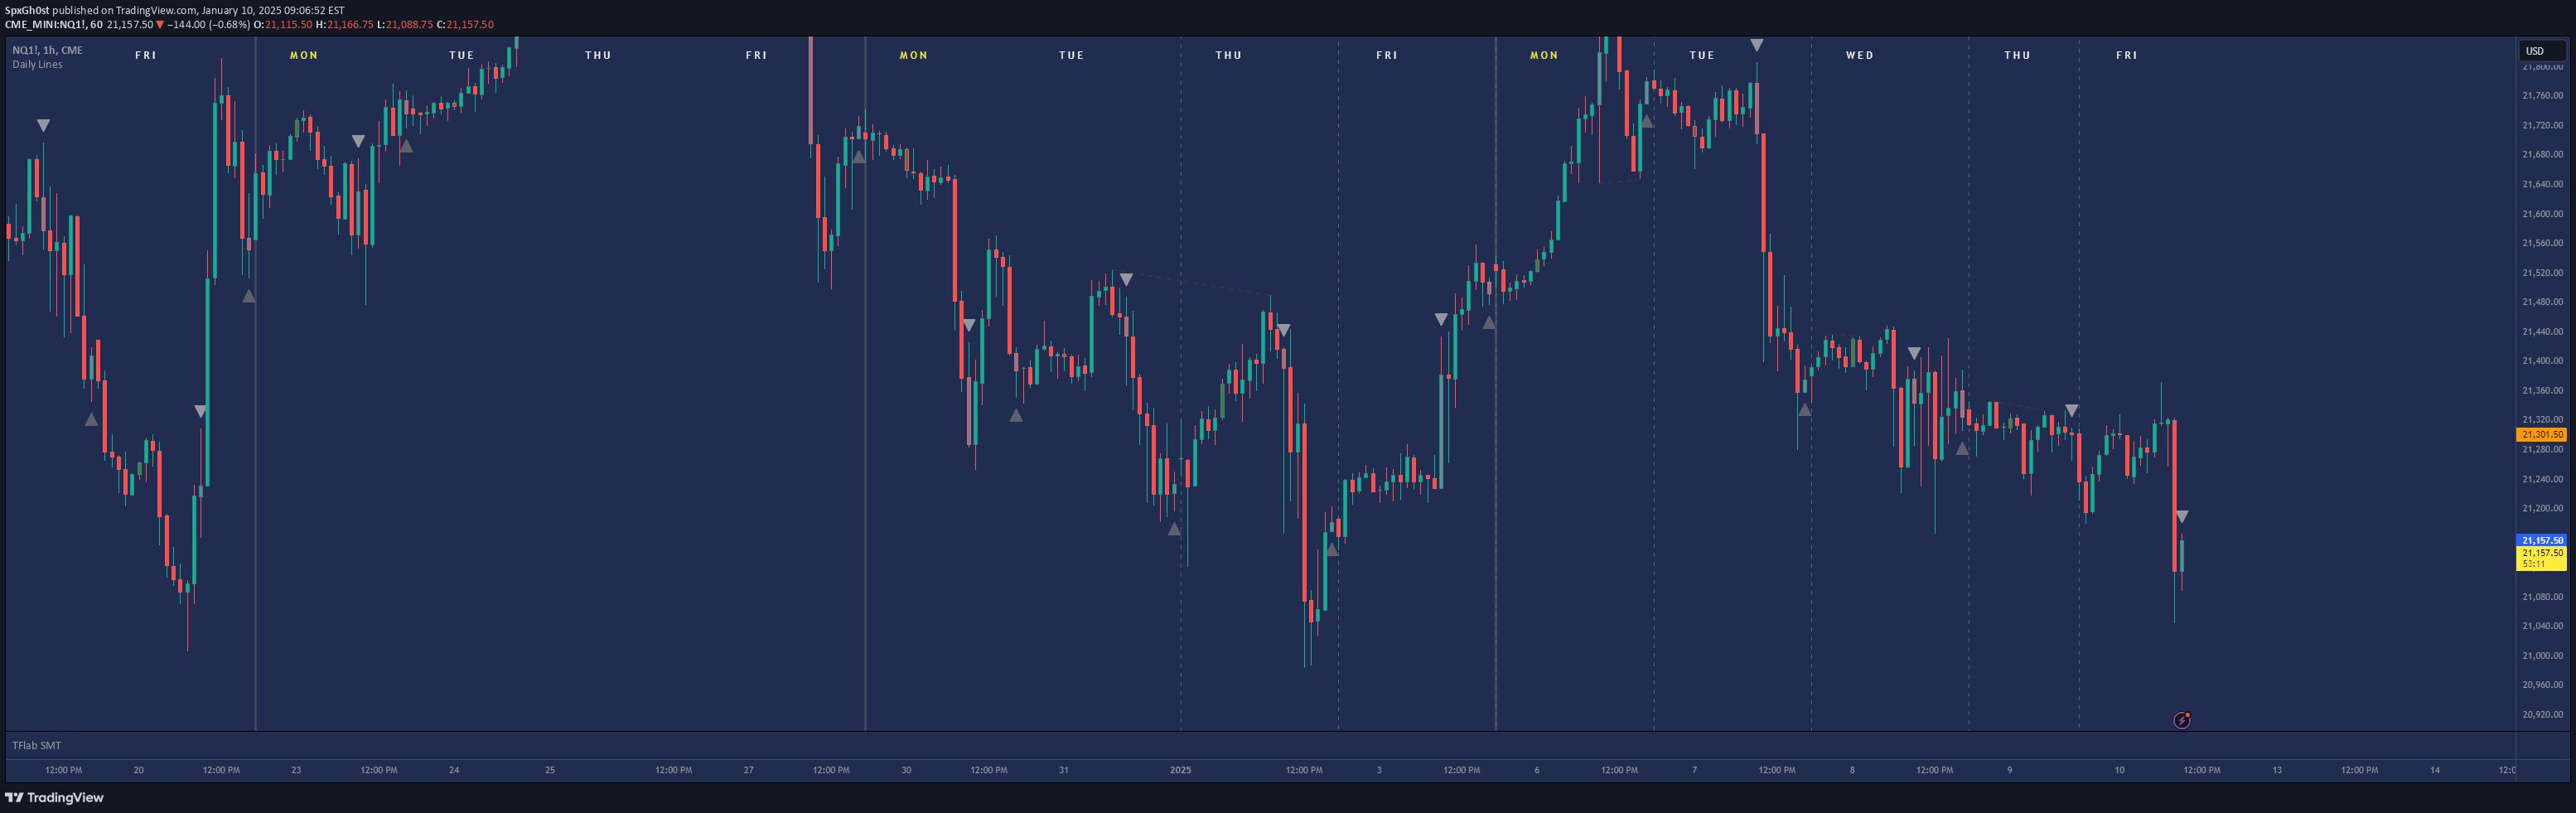
The ICT Digital Open Daily Dividers indicator operates by plotting vertical lines at the start of each trading day, with special emphasis on the Sunday open at 6 PM EST. Traders can customize the lines' color, style, and width to differentiate between regular trading days and the critical Sunday open. The script allows timezone adjustments and provides options to toggle between 6 PM and 12 AM daily open times.
The indicator creates visual markers that segment trading sessions, helping traders quickly identify market structure changes and key reference points. By offering flexible configuration options, the script enables traders to adapt the visualization to their specific trading strategy and market analysis preferences.
Why it may be useful
The ICT Digital Open Daily Dividers provides traders with a precise visual framework for analyzing market sessions and identifying critical trading periods. By highlighting specific opens, especially the Sunday open, the indicator supports traders in understanding market dynamics and potential directional shifts. It transforms abstract time-based information into clear, actionable visual cues that can enhance trading decision-making.
For traders following Institutional Order Flow methodologies, this indicator offers unprecedented flexibility in tracking market structure. The ability to customize session markers, adjust timezone settings, and distinguish between different trading days makes it a powerful tool for systematic and methodical market analysis.
When to explore it
This indicator is most effective for traders focusing on intraday and swing trading strategies, particularly those following ICT (Inner Circle Trader) methodologies. It works best in markets with clear daily session structures, such as forex, futures, and major stock indices where session opens and specific timeframes play a crucial role in market behavior.
Traders can leverage this tool during periods of potential market transition or when analyzing weekly market patterns. The indicator is particularly valuable during times of market volatility, when understanding session boundaries and key reference points can provide critical insights. Traders can use it to identify potential breakout zones, assess market sentiment, and develop more refined entry and exit strategies based on precise time-based market structure analysis.
Keep exploring
What we’ve verified
Access, alerts and repainting behaviour have not been independently verified for this indicator. Check the creator’s current publication and settings.
General descriptions and classifications are recovered research. Verified details above identify the specific checks we have completed. Check the creator’s current publication for later changes.