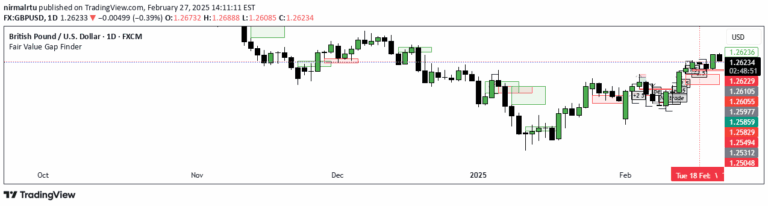
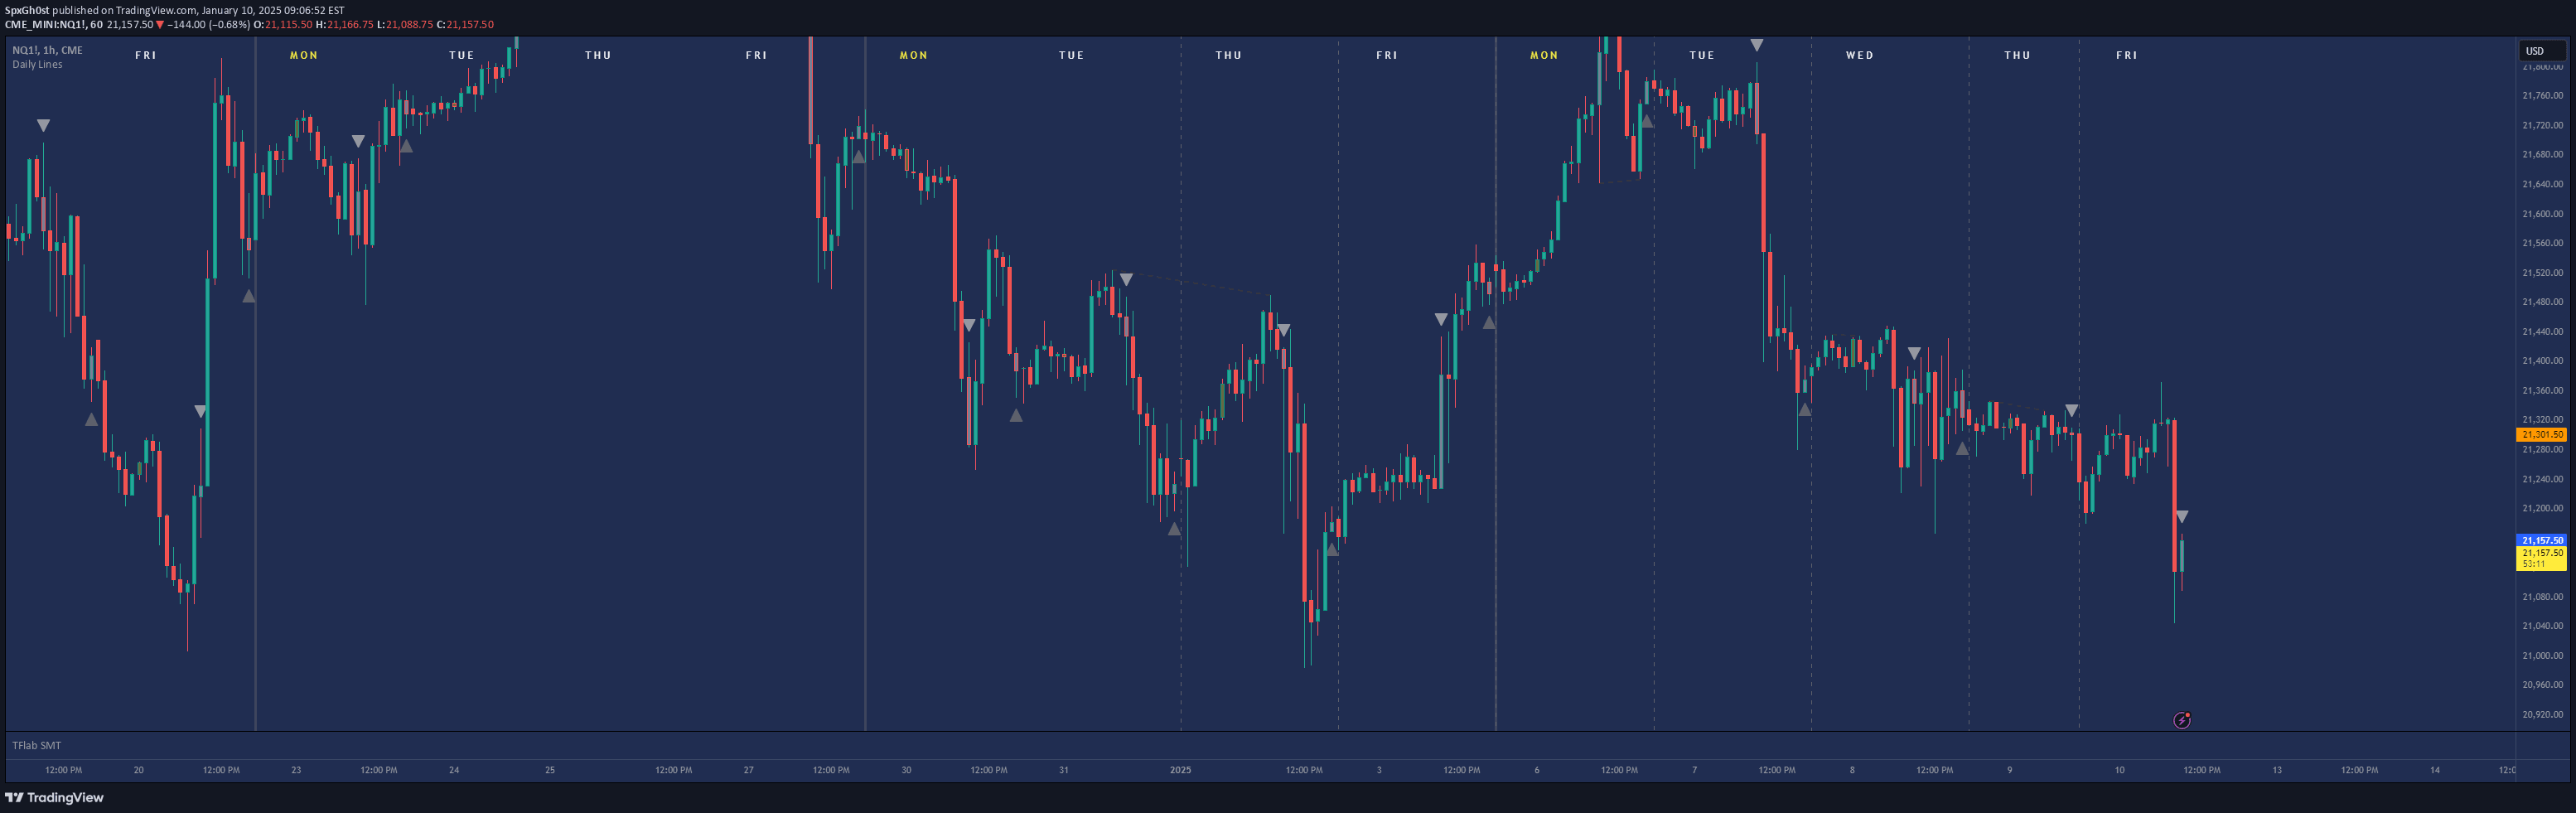
A multi-timeframe indicator that identifies and marks significant high and low points of Candle Range Type (CRT) candles, extending dynamic support and resistance levels.
Explore complementary indicator rolesHow it works
The indicator analyzes Candle Range Type (CRT) candles to identify significant high and low points across multiple timeframes. It uses an algorithmic approach to detect and mark these critical price levels, creating visual representations of key market zones.
By extending these high and low lines into the future, the tool generates dynamic support and resistance levels that help traders anticipate potential price reactions. The system allows extensive customization, enabling users to adjust line styles, colors, and visual elements to match their specific trading preferences and strategies.
Why it may be useful
Traders benefit from this indicator's ability to provide a comprehensive view of significant price zones across different timeframes. By visualizing important levels beyond the current chart, traders can maintain strategic awareness of potential market turning points and support/resistance areas.
The tool's flexibility in customization allows traders to adapt the indicator to their unique trading style, making it a versatile solution for technical analysis. Its multi-timeframe approach helps traders make more informed decisions by providing context and perspective beyond immediate price action.
When to explore it
This indicator is most effective when traders want to maintain a holistic view of market dynamics across multiple timeframes. It is particularly useful during periods of market consolidation or when analyzing potential trend reversals and key support/resistance zones.
Traders can leverage this tool in various market conditions, from ranging markets to trending environments, by adjusting its visual settings and interpretation. Its strength lies in providing a structured, visual approach to identifying significant price levels that might otherwise be overlooked in standard chart analysis.
Keep exploring
What we’ve verified
Access, alerts and repainting behaviour have not been independently verified for this indicator. Check the creator’s current publication and settings.
General descriptions and classifications are recovered research. Verified details above identify the specific checks we have completed. Check the creator’s current publication for later changes.