YOUR INDICATOR RESEARCH STARTS HERE

Find the right indicator.
Understand what it does.

Explore 11,183 indicators. Filter beyond the obvious.
Discover the tools that fit the way you trade.

THE INDICATOR LIBRARY

Explore the possibilities

11,183 tools to explore

11 indicators matching your filters
Save search
LevelsSignalTrend

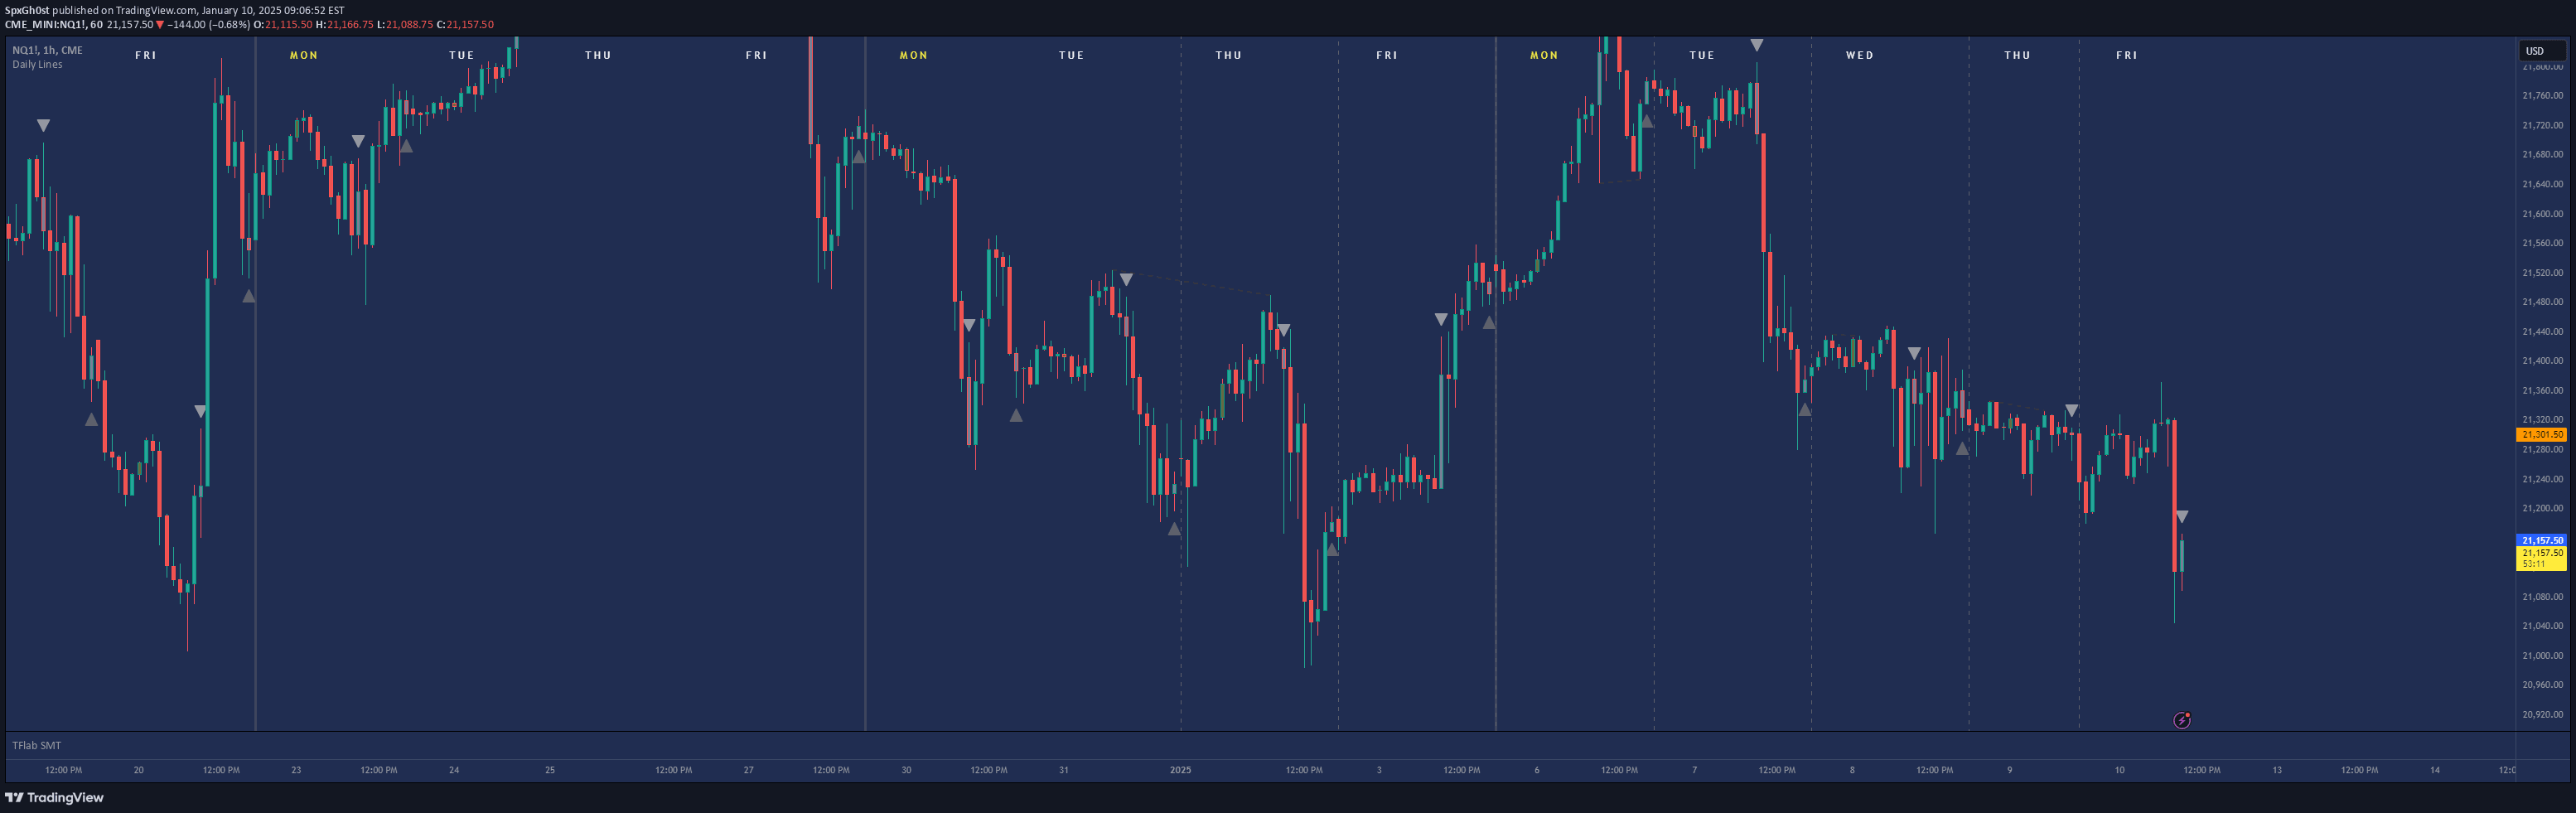
CRT Hourly/15m dividers and opens

by SpxGh0st

Range Separator is a visual trading tool that helps traders identify critical price levels and ranges by marking hourly and 15-minute intervals with customizable lines.

Main price chart · unverifiedScalping · Day Trading
Explore
718likes23.1Kviews19comments
Save
SignalTrend

HTF Overlay

by SpxGh0st

A customizable higher timeframe candle overlay that provides traders with real-time context of price action across multiple timeframes without switching charts.

Main price chart · unverifiedScalping · Day Trading
Explore
225likes6.1Kviews5comments
Save
Signal

First and Last Candle Highlight

by SpxGh0st

A specialized indicator for ES traders that highlights key candles at specific times: morning open, afternoon close, and overnight, providing visual reference for strategic trading decisions.

Main price chart · unverifiedScalping · Day Trading
Explore
215likes24.2Kviews6comments
Save
LevelsSignal

ICT Custom OPENS

by SpxGh0st

An ICT-based time reference indicator that highlights specific market open times and provides customizable day labels for precise trading strategy implementation.

Main price chart · unverifiedScalping · Day Trading
Explore
175likes3.8Kviews2comments
Save
SignalLevels

ICT Digital open Daily Dividers

by SpxGh0st

A TradingView indicator that highlights daily market sessions, opening prices, and key trading times with customizable vertical lines and markers for traders.

Main price chart · unverifiedScalping · Day Trading
Explore
68likes2Kviews1comments
Save
LevelsSignalTrend

Midnight Range Standard Deviations

by SpxGh0st

An ICT-based trading indicator that identifies potential trading opportunities using midnight range deviations, Fibonacci levels, and time-based price action analysis.

Main price chart · unverifiedScalping · Day Trading
Explore
58likes1.3Kviews0comments
Save
SignalTrend

Weekly H/L DOTW

by SpxGh0st

A statistical analysis indicator tracking weekly high and low price occurrences across different days, helping traders identify day-specific market behavior and potential trading patterns.

Main price chart · unverifiedDay Trading · Swing Trading
Explore
31likes831views0comments
Save

Likes, views, and comments are historical TradingView snapshots. They describe attention, not trading performance.

START WITH A QUESTION

A little less searching.
A lot more understanding.

Tell DeepAlpha what you need. Get an explanation, a shortlist,
and a direct path to the indicators behind it.

Ask DeepAlpha