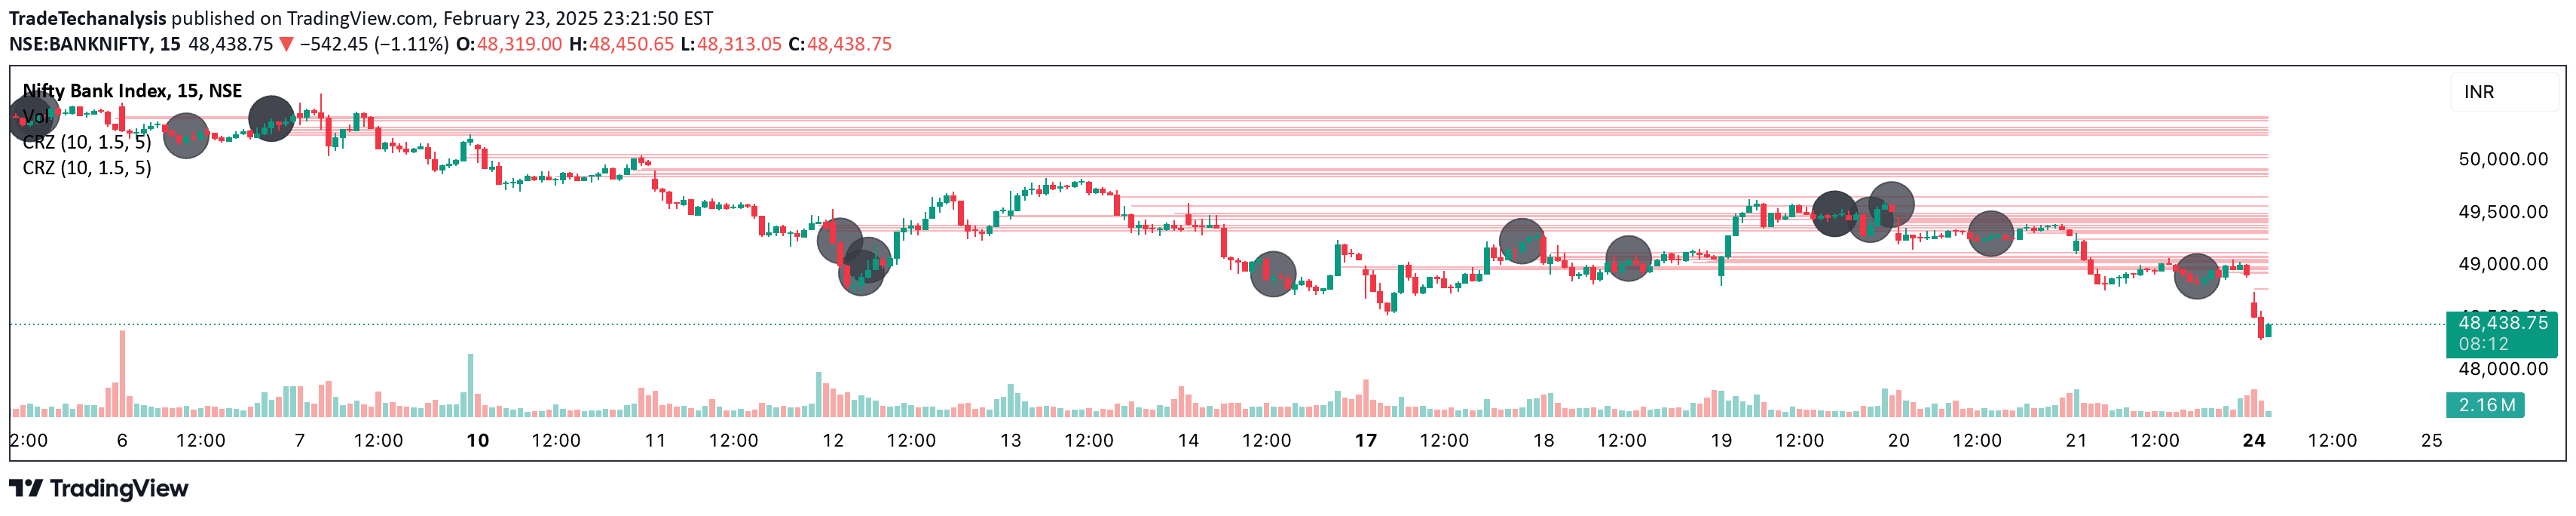
A sophisticated trading model using three-candle structures to analyze price action and identify high-probability trade setups across futures and forex markets.
Explore complementary indicator rolesHow it works
The 3 Candle Model operates by analyzing three consecutive price candles to understand market dynamics and potential trade opportunities. The first candle establishes a price range, the second candle provides confirmation through patterns like turtle soup, and the third candle signals potential breakout or continuation.
By integrating Open-High-Low-Close (OHLC) principles, traders can examine the relationship between key price points to gauge market sentiment. The model incorporates delivery states and fractal analysis, allowing traders to recognize repeating patterns at different scales and make more informed trading decisions.
Why it may be useful
The 3 Candle Model provides traders with a structured approach to understanding complex market movements by breaking down price action into meaningful segments. It offers a systematic method for identifying high-probability trade setups, reducing emotional decision-making and enhancing strategic trading.
By emphasizing the Power of Three (PO3) and integrating multiple analytical techniques, the model helps traders develop a more comprehensive view of market behavior. This approach not only improves trade entry and exit strategies but also encourages a disciplined, methodical approach to understanding market dynamics.
When to explore it
The 3 Candle Model is most effective during periods of clear market trends and defined price ranges in futures and forex markets. Traders should apply this model during key market timing windows, such as 3:00 AM, 6:00 AM, 9:00 AM, and 1:00 PM, when market liquidity and movement are typically more predictable.
The model works best when combined with other technical analysis tools and when traders can identify inside bar setups and potential turtle soup formations. It is particularly useful for traders seeking to target midpoints of identified ranges and prioritize high-quality, low-risk trade opportunities.
Keep exploring
What we’ve verified
Access, alerts and repainting behaviour have not been independently verified for this indicator. Check the creator’s current publication and settings.
General descriptions and classifications are recovered research. Verified details above identify the specific checks we have completed. Check the creator’s current publication for later changes.