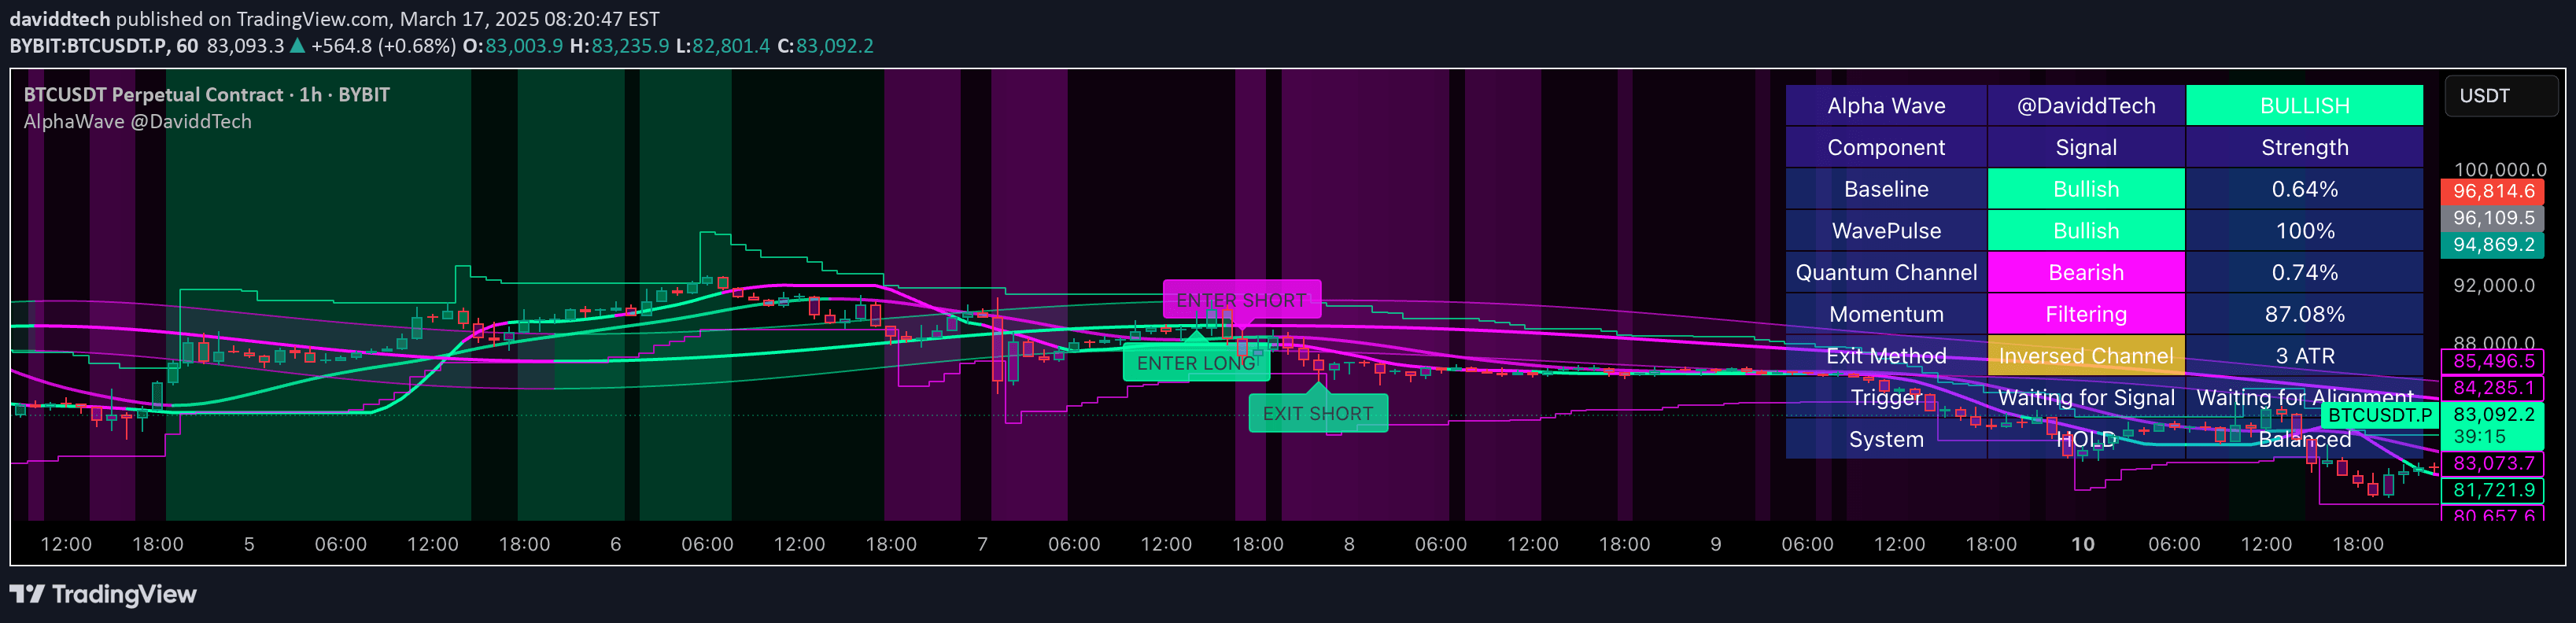
A sophisticated technical analysis tool that transforms candle data using advanced smoothing methods and volatility bands to generate dynamic trend and entry signals across different market conditions.
Explore complementary indicator rolesHow it works
The Candle Trend Power indicator operates by first transforming standard OHLC candles into advanced types like Heikin-Ashi or Linear Regression using multiple smoothing techniques. These transformations help reduce market noise and provide clearer trend visualization by applying methods such as EMA, SMA, or HMA to each candle's values.
The indicator then calculates volatility bands around the price using a formula that incorporates price percentage and Average True Range (ATR). These bands help identify potential overbought or oversold zones, while the candle coloring system provides immediate visual feedback about trend strength and momentum through color-coded bars and dynamic trend labels.
Why it may be useful
Traders benefit from this indicator's ability to cut through market complexity by offering multi-layered insights into price action and trend dynamics. By combining candle transformations, advanced smoothing, and volatility analysis, the tool provides a more nuanced view of market movements than traditional single-method indicators.
The flexible design allows traders to adapt the indicator to various market conditions, making it valuable for different trading styles and asset classes. Its comprehensive approach helps traders make more informed decisions by providing visual trend confirmation, volatility-based entry signals, and dynamic momentum assessments.
When to explore it
The Candle Trend Power is most effective in markets with clear trending characteristics, where price movements exhibit recognizable directional momentum. It performs exceptionally well in liquid markets like forex, major stock indices, and cryptocurrency pairs, where volatility and trend shifts are more pronounced and frequent.
Traders should prioritize using this indicator during periods of stable market conditions and when there's sufficient trading volume to generate reliable signals. It's particularly useful during range-bound and trending markets, offering insights that can help traders identify potential entry and exit points with greater precision.
Keep exploring
What we’ve verified
Access, alerts and repainting behaviour have not been independently verified for this indicator. Check the creator’s current publication and settings.
General descriptions and classifications are recovered research. Verified details above identify the specific checks we have completed. Check the creator’s current publication for later changes.