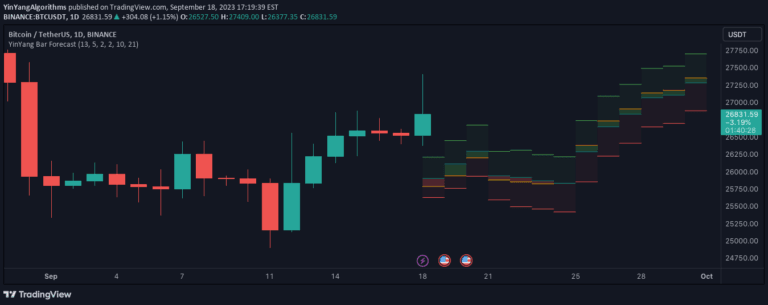
A machine learning KNN model that predicts future price movements by analyzing historical price patterns using Euclidean distance and selecting the most similar historical market behaviors.
Explore complementary indicator rolesHow it works
The K-Nearest Neighbors (KNN) model operates by identifying and analyzing historical price patterns that closely resemble current market conditions. It calculates Euclidean distances between current and past price data points to determine the most similar historical patterns, creating a dynamic selection mechanism that adapts to changing market environments.
By maintaining an efficiently updated list of the closest neighbors, the model can quickly select relevant historical data without extensive computational sorting. The algorithm then generates incremental price predictions based on these selected historical patterns, using a sophisticated approach that progressively builds a forecasted price trajectory.
Why it may be useful
The KNN-based prediction model provides traders with a data-driven approach to understanding potential future price movements by leveraging historical market similarities. It offers a sophisticated alternative to traditional technical analysis methods, using machine learning principles to identify complex pattern relationships that might be overlooked by conventional indicators.
By dynamically adapting to market conditions and focusing on the most relevant historical data points, this model can help traders make more informed decisions. The approach allows for nuanced pattern recognition and provides a quantitative framework for anticipating potential price trajectories across different financial markets.
When to explore it
This machine learning signal is most effective in markets with clear historical pattern repetitions and consistent underlying behaviors. It performs best in liquid markets with sufficient historical data, such as major currency pairs, stock indices, and frequently traded commodities where past price actions tend to exhibit recognizable structural similarities.
Traders should consider using this model during periods of relatively stable market conditions where historical patterns are more likely to provide meaningful predictive insights. It is particularly useful for short to medium-term trading strategies that rely on pattern recognition and statistical probability rather than fundamental analysis.
Keep exploring
What we’ve verified
Access, alerts and repainting behaviour have not been independently verified for this indicator. Check the creator’s current publication and settings.
General descriptions and classifications are recovered research. Verified details above identify the specific checks we have completed. Check the creator’s current publication for later changes.