
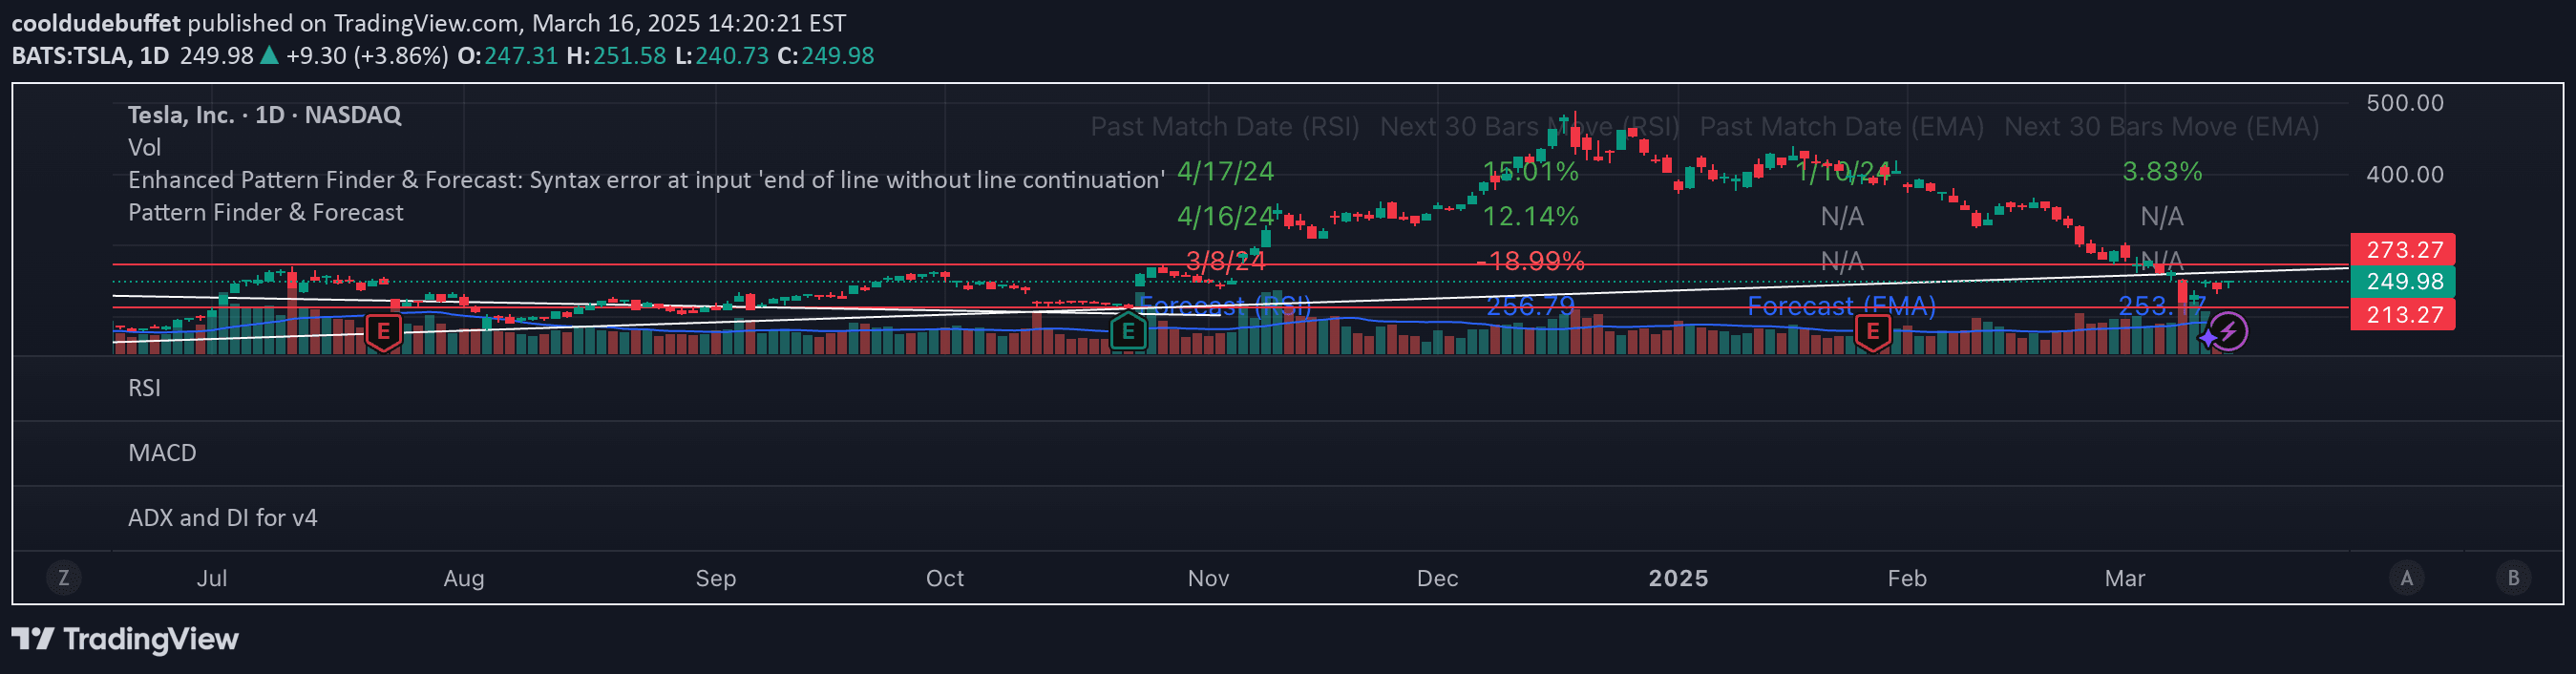
A pattern recognition tool that analyzes historical price data using EMA and RSI to identify similar market conditions and predict future price movements based on past patterns.
Explore complementary indicator rolesHow it works
The script begins by analyzing the most recent 30 bars of price data, calculating exponential moving averages (EMA) and relative strength index (RSI) to establish the current market context. It then scans historical price data to find previous 30-bar segments that closely resemble the current market conditions, using mathematical similarity metrics to identify matching patterns.
Once similar historical patterns are identified, the tool extrapolates potential future price movements by examining how those similar past patterns subsequently developed. This approach leverages historical market behavior to generate probabilistic predictions about upcoming price action, creating a data-driven forecasting mechanism that adapts to changing market dynamics.
Why it may be useful
Pattern recognition tools provide traders with a systematic approach to understanding market behavior by revealing recurring price structures that might not be immediately apparent through traditional analysis methods. By quantifying historical similarities, traders can gain insights into potential future price movements, helping them make more informed trading decisions.
The combination of EMA and RSI allows for a multi-dimensional analysis that considers both trend direction and momentum, giving traders a more comprehensive view of market conditions. This approach can help identify potential trading opportunities by highlighting historical precedents and providing a statistical framework for anticipating market movements.
When to explore it
This pattern recognition tool is most effective in markets with relatively consistent behavior and clear trending characteristics, such as forex, major stock indices, and liquid commodities. It works best when there are sufficient historical data points to establish meaningful pattern comparisons and when market conditions exhibit some level of repetitive behavior.
Traders should be most cautious when using this tool during periods of high market volatility, fundamental economic shifts, or significant news events that can dramatically alter market dynamics. It is particularly useful for short to medium-term trading strategies that rely on identifying recurring market patterns and statistical probabilities.
Keep exploring
What we’ve verified
Access, alerts and repainting behaviour have not been independently verified for this indicator. Check the creator’s current publication and settings.
General descriptions and classifications are recovered research. Verified details above identify the specific checks we have completed. Check the creator’s current publication for later changes.


