Order Block Finder (Experimental)
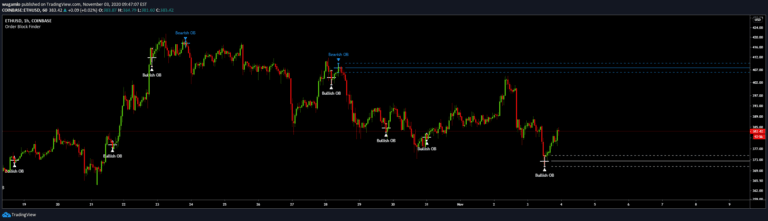
An indicator identifying institutional order blocks by detecting significant price zones where potential trend reversals or continuations might occur based on sequential candle patterns.
Explore 11,183 indicators. Filter beyond the obvious.
Discover the tools that fit the way you trade.
11,183 tools to explore
An indicator identifying institutional order blocks by detecting significant price zones where potential trend reversals or continuations might occur based on sequential candle patterns.
A machine learning-powered moving average that uses Gaussian Process Regression to estimate price trends, with adjustable responsiveness and band extremities for identifying potential market reversals.
A machine learning-enhanced momentum oscillator that analyzes market trends using weighted moving averages and k-Nearest Neighbors algorithm for dynamic and adaptive momentum prediction.
A trading signal using Kadane's algorithm to identify the largest market impulse within a window, then applying Murrey's math lines to map potential price movements and trading opportunities.
A machine learning regression tool using RANSAC to create robust trend analysis by filtering out market noise and identifying underlying price movements with greater accuracy.
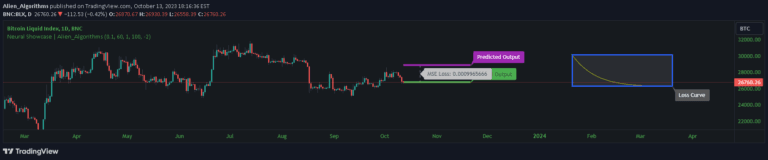
A neural network trading signal that generates price predictions using a single hidden layer with two neurons, demonstrating machine learning principles in technical analysis.
A machine learning-powered trendline indicator that uses k-means clustering to automatically identify and filter price trend clusters, offering dynamic trend visualization and analysis.
A machine learning-enhanced RSI indicator that dynamically adapts overbought and oversold thresholds using clustering techniques, providing more precise trading signals across different market conditions.
The Quasimodo (QM) pattern is a specialized head and shoulders formation that identifies potential price reversals in trending markets by analyzing specific price structure movements.
RibboNN ML is a machine learning indicator that predicts market direction using a conditional class and nearest neighbor algorithm, visualizing trends through a color-changing ribbon.
A price tracking indicator that shows multiple time-based levels including daily, weekly, and monthly open, high, and low prices with customizable color and line style settings.
Market Smith's advanced charting tool providing comprehensive stock analysis through moving averages, pivot points, relative strength line, and rating to evaluate stock performance.
Likes, views, and comments are historical TradingView snapshots. They describe attention, not trading performance.