[RS]ZigZag Multiple Methods - Forecast - patterns - labels
A comprehensive zigzag indicator featuring multiple calculation methods for identifying trend changes and price reversals across different market conditions and trading styles.
Explore 11,183 indicators. Filter beyond the obvious.
Discover the tools that fit the way you trade.
11,183 tools to explore
A comprehensive zigzag indicator featuring multiple calculation methods for identifying trend changes and price reversals across different market conditions and trading styles.
A trading signal using Kadane's algorithm to identify the largest market impulse within a window, then applying Murrey's math lines to map potential price movements and trading opportunities.
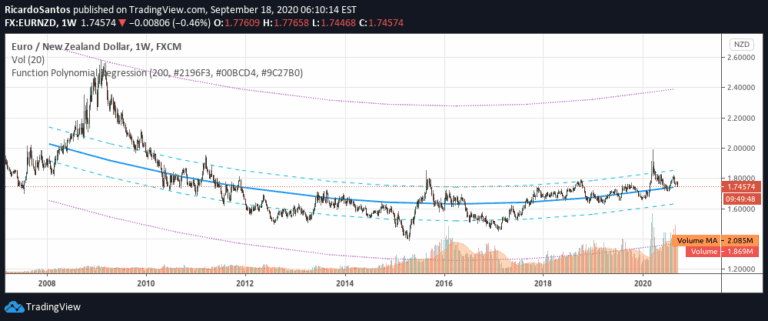
A polynomial regression function that analyzes data points to provide predictions, deviations, and statistical insights about trend and momentum patterns in financial datasets.
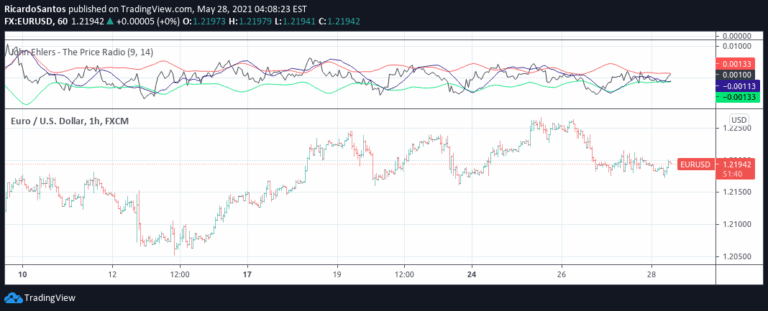
An innovative signal processing technique that treats price curves like radio waves, using AM and FM demodulation to extract trading signals from market noise.
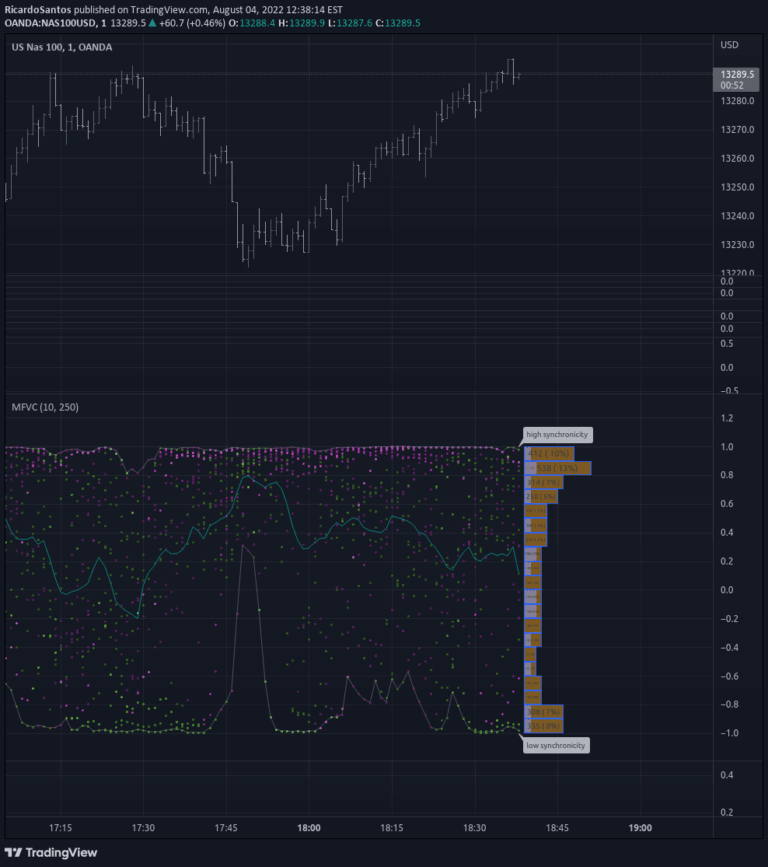
A complex indicator analyzing the relationship between trading volume and price volatility, using color intensity to represent window length and volatility direction.
A multiple information panel using tables provides traders with comprehensive visual data representations across various trading metrics, enabling quick and efficient analysis of complex market information.
Keltner Worms is an experimental trading signal using Keltner Channels with an adaptive multiplier to generate dynamic forecast areas for price movement and trend identification.
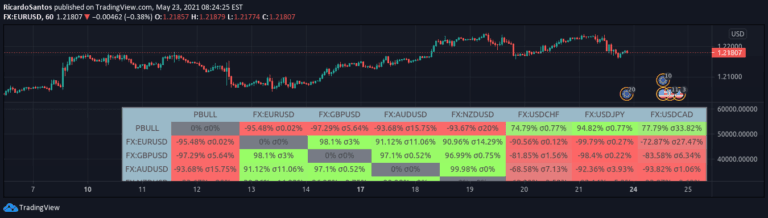
A Correlation Matrix utilizes statistical tables to analyze relationships between different financial variables, helping traders understand interconnected market behaviors and potential predictive patterns.
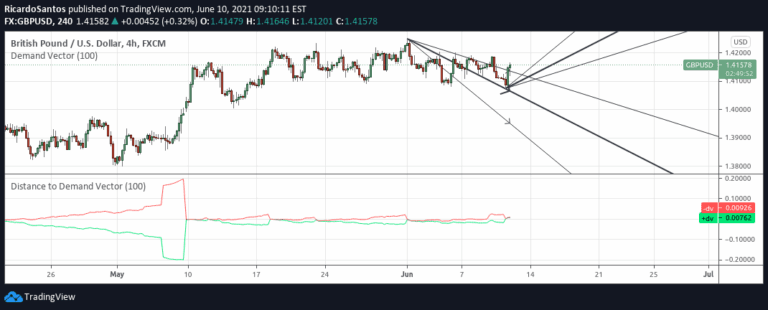
A trading signal that evaluates market demand by measuring the distance to a demand vector derived from price range analysis. It helps traders understand potential market movement direction.
A technique analyzing Donchian Channel percent widths to identify cyclical new price peaks, providing insights into market dynamics and potential trend shifts.
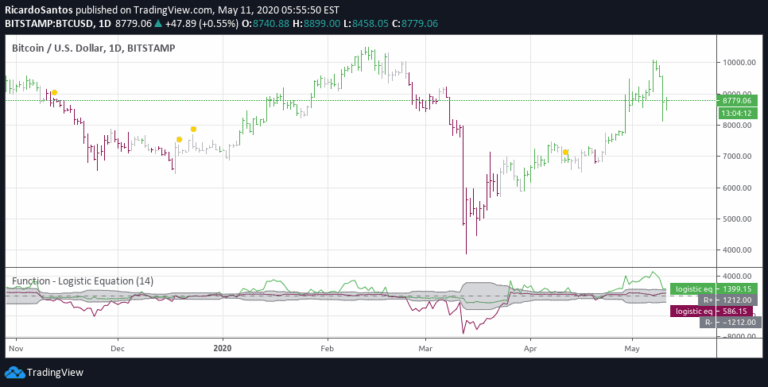
An experimental trading approach exploring the logistic equation's potential correlation with market dynamics, suggesting mathematical patterns might predict or explain market behavior.
A live trading volume analysis tool that processes intrabar volume dynamics, tracking delta changes and calculating statistical metrics in real-time during market trading sessions.
Likes, views, and comments are historical TradingView snapshots. They describe attention, not trading performance.