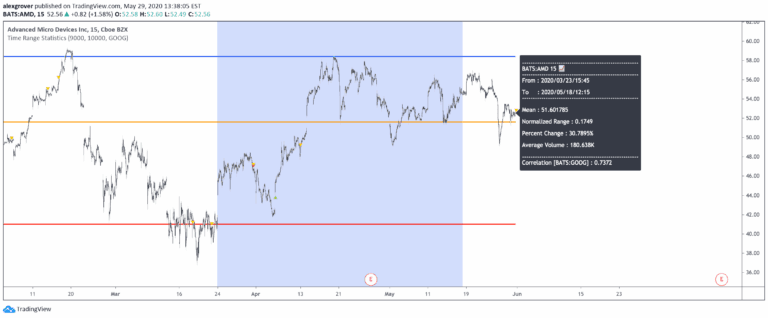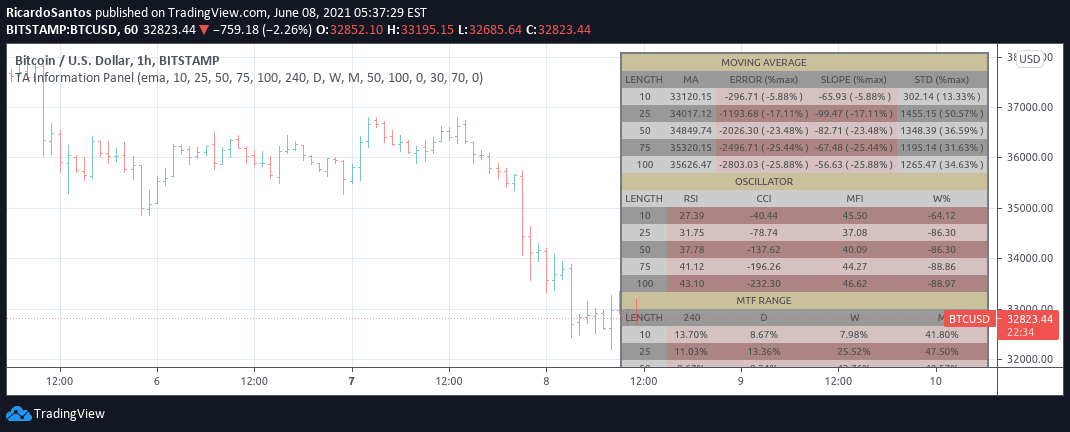
A multiple information panel using tables provides traders with comprehensive visual data representations across various trading metrics, enabling quick and efficient analysis of complex market information.
Explore complementary indicator rolesHow it works
Multiple information panels utilize structured tables to organize and display diverse trading data in a systematic manner. These panels consolidate different metrics like price movements, volume trends, and technical indicators into easily readable formats.
Each table column represents a specific data point, while rows showcase sequential information. The design allows traders to quickly scan and compare different market parameters simultaneously. Panels can be customized to show real-time or historical data. Color coding and conditional formatting help highlight critical information and trends
Why it may be useful
Multiple information panels simplify complex market data interpretation by presenting information in a clear, organized structure. They reduce cognitive load by eliminating the need to process scattered information from multiple sources. Traders can make faster, more informed decisions by having comprehensive data readily accessible.
These panels enhance analytical capabilities by providing holistic market views. They support quick pattern recognition and trend identification. Visual organization improves data comprehension and decision-making speed. Panels help traders maintain a structured approach to market analysis
When to explore it
Multiple information panels are most effective during high-volatility market conditions requiring rapid data assessment. They prove particularly useful for traders managing multiple assets or trading strategies simultaneously. These panels work best when dealing with complex market environments involving numerous variables.
Institutional traders and professional analysts frequently utilize such comprehensive display methods. They are ideal for comparing different market instruments or tracking multiple technical indicators concurrently. Panels become crucial during critical market events or when making time-sensitive trading decisions
Keep exploring
What we’ve verified
Access, alerts and repainting behaviour have not been independently verified for this indicator. Check the creator’s current publication and settings.
General descriptions and classifications are recovered research. Verified details above identify the specific checks we have completed. Check the creator’s current publication for later changes.