Divergence Indicator (any oscillator)
A versatile divergence indicator that identifies potential trend reversals by comparing price action with an oscillator's momentum, adaptable to multiple technical indicators.
Explore 11,183 indicators. Filter beyond the obvious.
Discover the tools that fit the way you trade.
11,183 tools to explore
A versatile divergence indicator that identifies potential trend reversals by comparing price action with an oscillator's momentum, adaptable to multiple technical indicators.
A comprehensive multi-indicator script that displays various technical indicators in separate windows, allowing traders to customize and analyze market momentum, volume, and trend signals.
A dynamic trading panel displaying multiple technical indicators in a color-coded table format, allowing traders to quickly assess market conditions across multiple symbols simultaneously.
A customizable Pine Script indicator that generates a mini-chart displaying the last 10 candles with detailed visual settings, providing quick insights into recent price action and market behavior.
A multi-chart analysis tool enabling traders to simultaneously view multiple financial instruments, technical indicators, and performance metrics across different timeframes.
A comprehensive TradingView script that mimics MarketSmith charts, offering customizable moving averages, RS Rating, and high/low point detection for technical analysis.
A dynamic moving average panel that reveals market sentiment by displaying the direction of multiple moving averages across different time periods, helping traders understand trend dynamics.
A noise-filtered oscillator using John Ehlers' SuperSmoother filter to identify market trends and mean reversion points with enhanced clarity and precision.
A comprehensive trading script that recreates TradingView's watchlist stats panel, offering real-time performance metrics and historical comparisons across multiple timeframes.
Advanced EMA-based trading signal tool with multiple EMA lines, support/resistance levels, and comprehensive indicator panel for precise market trend analysis and trading decisions.
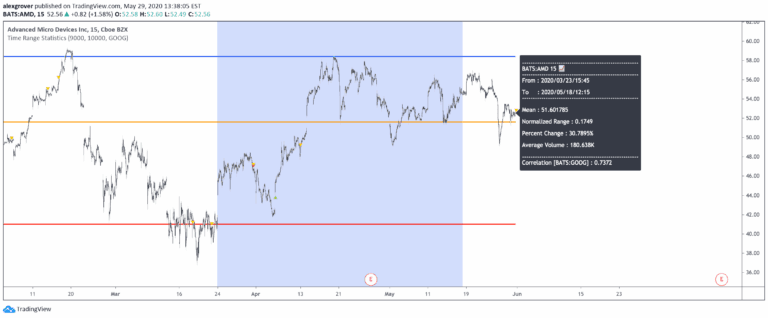
A comprehensive trading script that calculates various price statistics within a user-selected range, offering insights into price movement, volatility, and market trends through statistical analysis.
A multiple information panel using tables provides traders with comprehensive visual data representations across various trading metrics, enabling quick and efficient analysis of complex market information.
Likes, views, and comments are historical TradingView snapshots. They describe attention, not trading performance.