
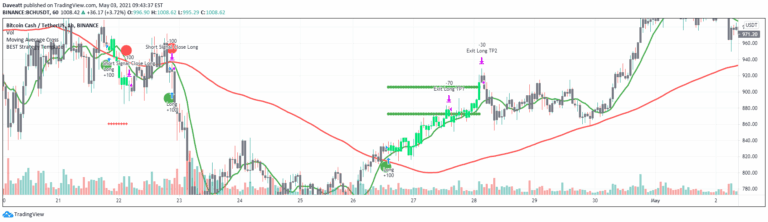
Ultimate Strategy Template
A universal strategy template for TradingView that allows traders to convert any indicator into a tradable strategy with comprehensive risk management and backtesting features.
Explore 11,183 indicators. Filter beyond the obvious.
Discover the tools that fit the way you trade.
11,183 tools to explore
A universal strategy template for TradingView that allows traders to convert any indicator into a tradable strategy with comprehensive risk management and backtesting features.
A comprehensive trading script that recreates TradingView's watchlist stats panel, offering real-time performance metrics and historical comparisons across multiple timeframes.
Dollar-Cost Averaging (DCA) indicator that compares investing a fixed amount periodically versus a lump sum investment, helping traders analyze long-term investment strategies across different timeframes.
A multi-asset Linear Regression Channel screener that tracks trend direction and momentum across multiple financial instruments using advanced statistical analysis.
Volume Weighted Average Price (VWAP) is a dynamic trading indicator that calculates average price weighted by volume, offering insights into market trends and price action.
A Linear Regression Forecast Tool that uses statistical analysis to predict potential future price trends by finding the best-fitting line through historical market data points.
Advanced trading screener that provides comprehensive multi-asset technical analysis using dynamic oscillators, enabling real-time market opportunity tracking across 40 trading pairs.
A comprehensive crypto sector performance indicator that tracks and compares performance across six key market sectors, enabling strategic sector rotation and market analysis.
An economic cycle indicator tracking interest rates and inflation to identify current economic seasons and recommend strategic investment approaches across different market conditions.
A comprehensive TradingView-inspired market analysis tool featuring an interactive watchlist, distribution visualization, and performance comparison panel in PineScript.
A festive trading indicator that transforms charts into a Christmas-themed visual experience, adding humor and holiday spirit to technical analysis while tracking market movements.
A compound interest simulator that calculates investment growth over time, demonstrating how fees and compounding frequency impact long-term returns for traders and investors.
Likes, views, and comments are historical TradingView snapshots. They describe attention, not trading performance.