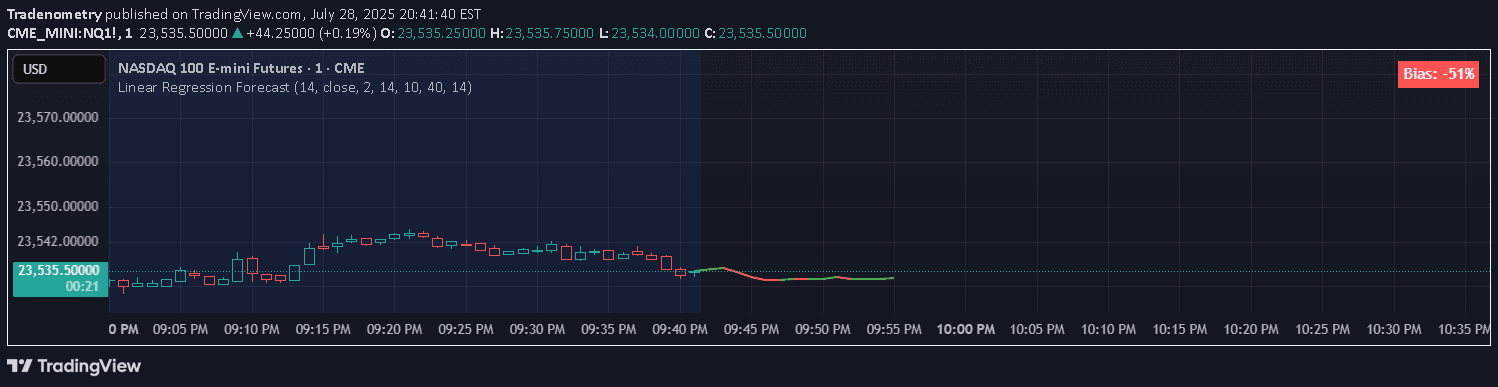
A Linear Regression Forecast Tool that uses statistical analysis to predict potential future price trends by finding the best-fitting line through historical market data points.
Explore complementary indicator rolesHow it works
The Linear Regression Forecast Tool operates by first selecting a market indicator like Moving Averages or Bollinger Bands as the base data. It then applies the ta.linreg function to calculate a linear regression curve fitted to the selected indicator over a specified period, essentially finding the mathematical line that best represents the trend.
The tool calculates the slope of this regression curve using the last two points and uses this slope to extrapolate and forecast future potential values. By plotting these forecasted points on the chart, traders can visually see a potential continuation of the current trend, providing a data-driven projection of possible price movements.
Why it may be useful
Linear Regression Forecast Tools are crucial for traders seeking a structured, mathematical approach to understanding market trends and potential future price movements. By transforming historical data into a predictive model, these tools offer insights beyond simple visual trend analysis, providing a more quantitative perspective on market behavior.
The tool's significance lies in its ability to convert complex market data into a straightforward, visual representation of potential future trends. This helps traders make more informed decisions by offering a statistical foundation for their trading strategies, bridging the gap between historical performance and potential future price action.
When to explore it
The Linear Regression Forecast Tool is most effective in markets showing relatively stable, trending conditions where price movements demonstrate a consistent directional bias. It works best when applied to timeframes and assets that exhibit clear, identifiable trends, such as major currency pairs, blue-chip stocks, or commodities with strong directional momentum.
Traders should be cautious about using this tool during periods of high market volatility or during significant economic events that can dramatically alter market dynamics. It is most reliable when used in conjunction with other technical analysis tools and fundamental research, helping to confirm potential trade setups rather than being used as a standalone prediction mechanism.
Keep exploring
What we’ve verified
Access, alerts and repainting behaviour have not been independently verified for this indicator. Check the creator’s current publication and settings.
General descriptions and classifications are recovered research. Verified details above identify the specific checks we have completed. Check the creator’s current publication for later changes.