
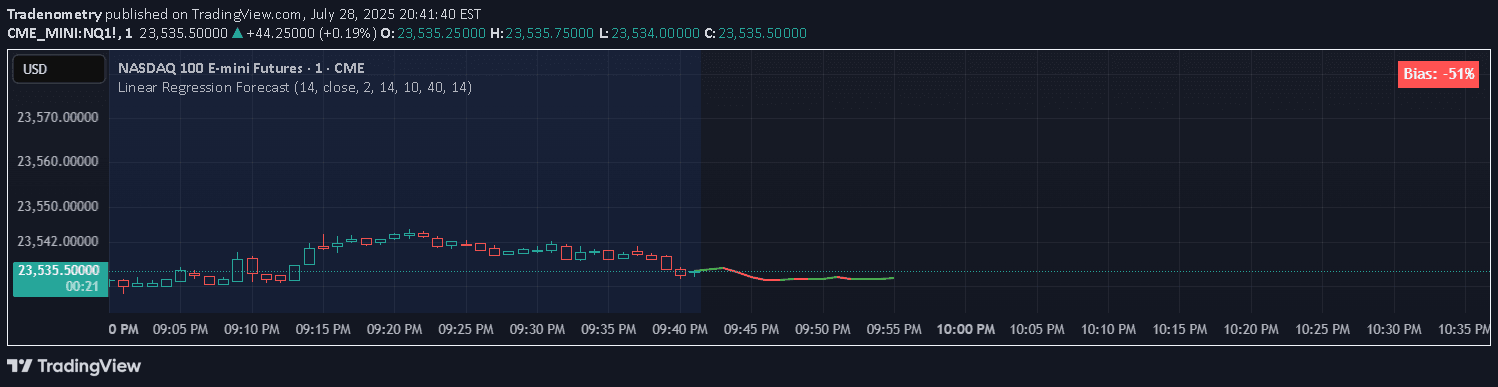
A linear regression-based forecasting tool that creates a fan of projected price lines using multiple look-back windows, revealing potential price trends and future movement probabilities.
Explore complementary indicator rolesHow it works
The indicator computes multiple simple linear regressions using progressively longer look-back windows, starting from 2 bars up to a user-defined maximum length. For each window size, it calculates the least-squares slope and intercept over the most recent bars, then projects the regression line forward to create a forecast point.
These forecast points are then connected into a continuous polyline, with segments color-coded based on their slope direction. Ascending segments are drawn in green, indicating non-negative trends, while descending segments are colored red, signaling potential negative price movements.
Why it may be useful
This forecasting tool provides traders with a dynamic visual representation of potential price trajectories across different time horizons. By generating multiple regression lines with varying look-back periods, it offers insights into both short-term and longer-term price trends, helping traders understand potential market momentum.
The color-coded segments allow quick interpretation of trend direction, enabling traders to rapidly assess market sentiment and potential future price movements. This multi-horizon approach helps traders develop a more comprehensive view of potential price behavior beyond traditional single-window analysis.
When to explore it
The linear regression forecast fan is most effective in markets with clear directional trends and relatively consistent price movements. It works particularly well in markets with moderate volatility, where price movements show some predictable patterns over short to medium-term periods.
Traders should use this tool in conjunction with other technical indicators and fundamental analysis to confirm signals and validate potential trade opportunities. It is especially useful for traders seeking to understand potential price trajectories across multiple time frames and looking for a visual representation of trend dynamics.
Keep exploring
What we’ve verified
Access, alerts and repainting behaviour have not been independently verified for this indicator. Check the creator’s current publication and settings.
General descriptions and classifications are recovered research. Verified details above identify the specific checks we have completed. Check the creator’s current publication for later changes.





