YOUR INDICATOR RESEARCH STARTS HERE

Find the right indicator.
Understand what it does.

Explore 11,183 indicators. Filter beyond the obvious.
Discover the tools that fit the way you trade.

THE INDICATOR LIBRARY

Explore the possibilities

11,183 tools to explore

18 indicators matching your filters
Save search
TrendVolatilityEditor’s pick

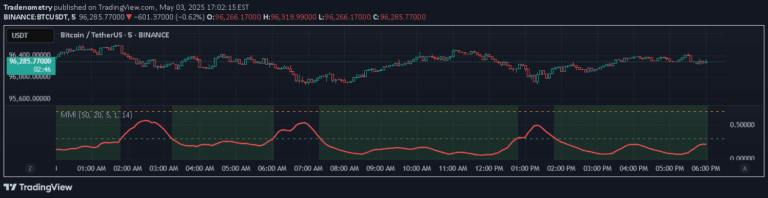
Market Manipulation Index (MMI)

by Tradenometry

The Composite Manipulation Index (CMI) is a market integrity tool that quantifies structural chaos by analyzing price behavior's predictability and rhythmic deviation to detect potential market manipulation.

Separate pane · unverifiedDay Trading · Swing Trading
Explore
429likes13.7Kviews7comments
Save
MomentumOscillatorSignal

CBO (Candle Bias Oscillator)

by Tradenometry

A unique technical analysis tool that captures market sentiment through candlestick bias, volume momentum, and volatility analysis, providing insights into potential market turning points.

Separate pane · unverifiedScalping · Day Trading
Explore
104likes3.7Kviews0comments
Save
SignalTrendVolatility

Candle Bias Forecast

by Tradenometry

A multi-timeframe analysis tool that generates price forecast levels by calculating candle biases and using Average True Range to normalize potential market movements.

Main price chart · unverifiedScalping · Day Trading
Explore
76likes1.5Kviews0comments
Save
TrendMomentum

Fibonacci Forecast Indicator

by Tradenometry

A Fibonacci-based price projection indicator that uses moving averages to forecast potential future price movements by extending current momentum into projected lines.

Main price chart · unverifiedDay Trading · Swing Trading
Explore
73likes1.3Kviews0comments
Save
TrendSignal

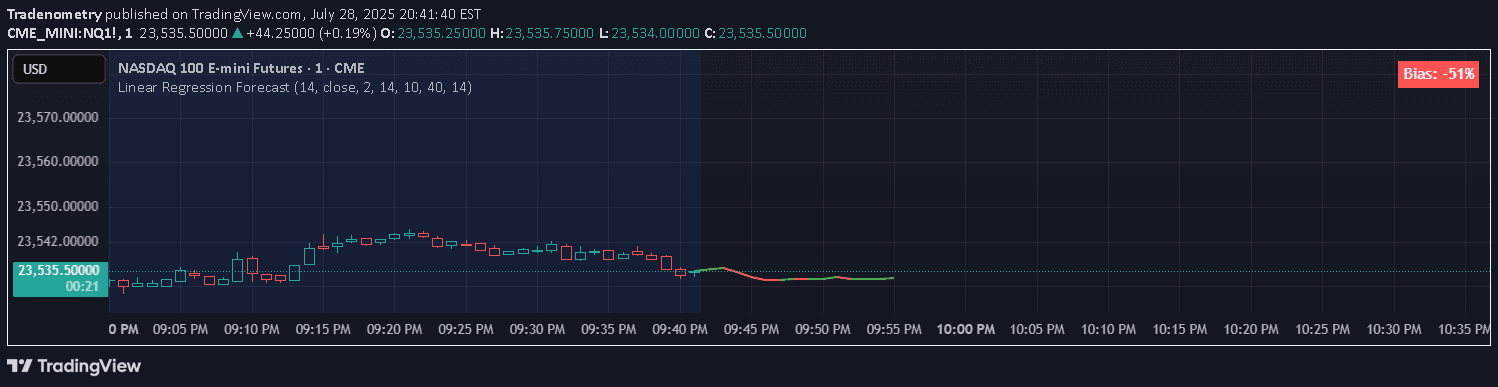
Linear Regression Forecast

by Tradenometry

A linear regression-based forecasting tool that creates a fan of projected price lines using multiple look-back windows, revealing potential price trends and future movement probabilities.

Main price chart · unverifiedScalping · Day Trading
Explore
52likes802views0comments
Save
SignalTrend

Taylor Series Forecast

by Tradenometry

A predictive indicator using Taylor Series expansion to project future price trajectories by analyzing price momentum and acceleration through exponential moving average smoothing.

Main price chart · unverifiedScalping · Day Trading
Explore
30likes434views0comments
Save
LevelsSignalTrend

Pullback Setup Helper

by Tradenometry

A visual trading tool that identifies high-probability pullback entry zones in trends by calculating dynamic support and resistance areas using recent price extremes and ATR-based volatility measures.

Main price chart · unverifiedDay Trading · Swing Trading
Explore
30likes528views1comments
Save
TrendLevels

Open-Close / High-Low Ribbon

by Tradenometry

A price visualization tool that smooths Open, Close, High, and Low values using moving averages to reveal underlying market structure with reduced noise and color-coded trend indication.

Main price chart · unverifiedScalping · Day Trading
Explore
29likes587views0comments
Save

Likes, views, and comments are historical TradingView snapshots. They describe attention, not trading performance.

START WITH A QUESTION

A little less searching.
A lot more understanding.

Tell DeepAlpha what you need. Get an explanation, a shortlist,
and a direct path to the indicators behind it.

Ask DeepAlpha