
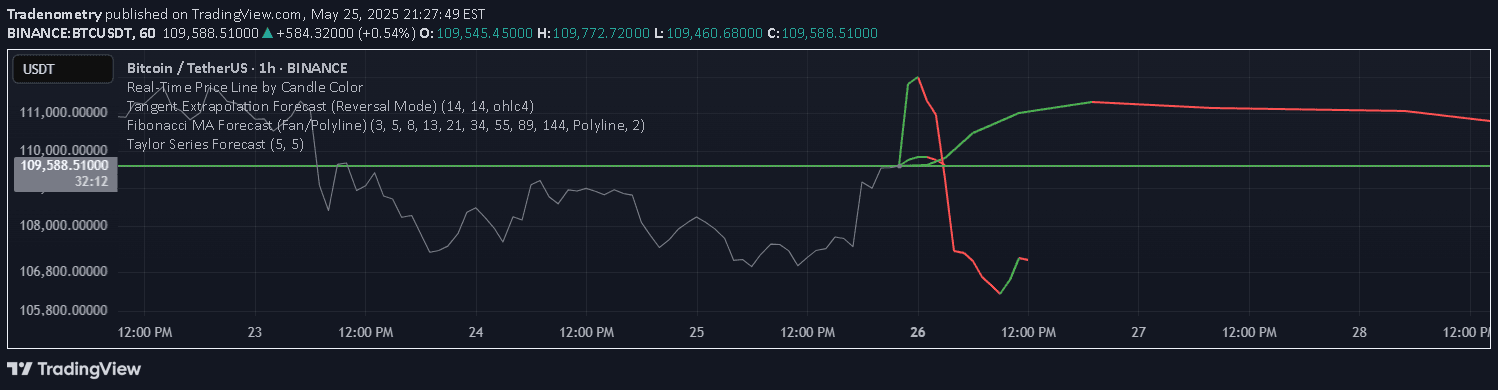
A Fibonacci-based price projection indicator that uses moving averages to forecast potential future price movements by extending current momentum into projected lines.
Explore complementary indicator rolesHow it works
This indicator calculates Simple Moving Averages (SMAs) using Fibonacci periods like 3, 5, 8, 13, and 21 bars. It measures the distance between the current closing price and each SMA, then projects a forecast line forward by the same distance. If the price is above an SMA, the forecast line extends higher, indicating a bullish bias.
Conversely, if the price is below the SMA, the forecast line extends lower, suggesting a bearish bias. The indicator creates connected line segments from the current bar's close to each forecast point, providing a visual representation of potential price paths
Why it may be useful
This indicator helps traders visualize potential future price movements by leveraging current market momentum. It provides a unique perspective on price trajectory using Fibonacci-based moving averages, which can offer insights into potential trend continuation or reversal.
By showing projected price paths, traders can anticipate possible market directions and make more informed trading decisions. The visual nature of the indicator makes it easy to interpret and can be a valuable tool for understanding market dynamics and potential price trends
When to explore it
This indicator is most effective in markets with clear momentum and trending conditions. It works best when price is showing consistent directional movement and when used in conjunction with other technical analysis tools. Traders should apply this indicator during periods of stable market trends, such as during strong bullish or bearish markets.
It is particularly useful for swing traders and day traders looking to understand potential price progression. However, traders should always combine this indicator with other forms of analysis and maintain robust risk management strategies
Keep exploring
What we’ve verified
Access, alerts and repainting behaviour have not been independently verified for this indicator. Check the creator’s current publication and settings.
General descriptions and classifications are recovered research. Verified details above identify the specific checks we have completed. Check the creator’s current publication for later changes.


