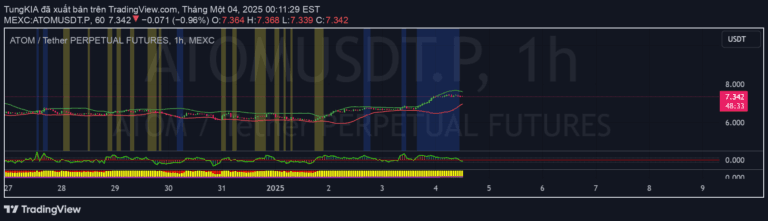
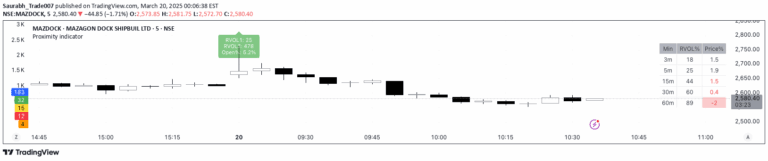
Advanced technical analysis tool measuring market direction through price momentum, volume integration, and volatility adjustments across different market conditions and timeframes.
Explore complementary indicator rolesHow it works
The Direction Coefficient Indicator processes price data using EMA smoothing to reduce market noise and generate percentage-based measurements. It calculates momentum by establishing a dynamic reference period and applying sophisticated computational techniques that normalize price movements.
The indicator integrates volume weighting and volatility adjustments to enhance signal accuracy. When activated, these features help validate price movements by considering trading volume and market volatility, ensuring more robust and adaptive momentum calculations across different market environments.
Why it may be useful
The indicator provides traders with a comprehensive tool for understanding market momentum and potential trend changes by combining multiple analytical components into a single, customizable signal. Its advanced design helps traders make more informed decisions by offering insights beyond traditional momentum indicators.
By incorporating volume and volatility adjustments, the indicator reduces false signals and provides a more nuanced view of market conditions. Traders can benefit from early trend reversal warnings, systematic risk management, and adaptable signal generation that remains sensitive to changing market dynamics.
When to explore it
The Direction Coefficient Indicator works best in liquid markets with significant price movements where volume plays a crucial role in validating momentum. Traders should consider using it during trending market conditions and when seeking early identification of potential trend reversals or momentum shifts.
The indicator is particularly effective when traders start with default settings and gradually adjust parameters based on specific trading styles and market characteristics. It proves most valuable during periods of moderate to high market activity, where its volume and volatility features can provide meaningful insights into price movement dynamics.
Keep exploring
What we’ve verified
Access, alerts and repainting behaviour have not been independently verified for this indicator. Check the creator’s current publication and settings.
General descriptions and classifications are recovered research. Verified details above identify the specific checks we have completed. Check the creator’s current publication for later changes.