
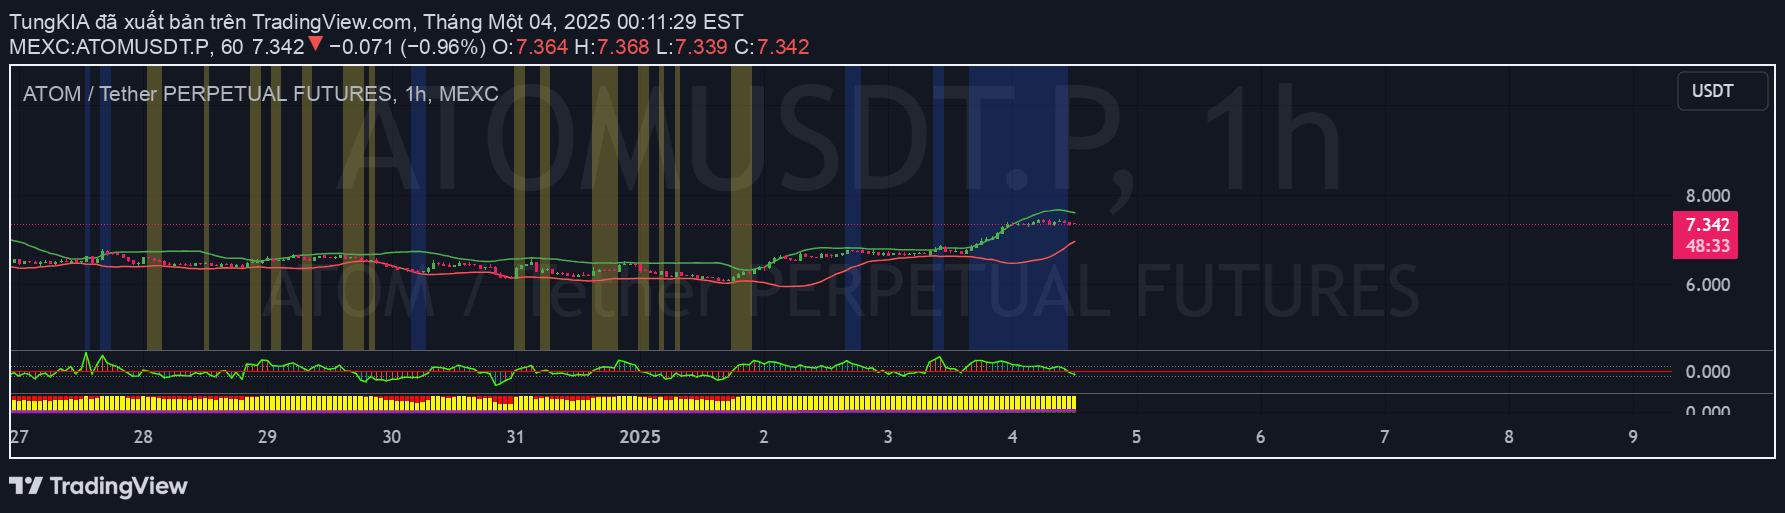
A trading tool that identifies market conditions by analyzing ADX, RSI, and Bollinger Bands to distinguish between sideways markets and strong trend environments.
Explore complementary indicator rolesHow it works
The tool uses three key technical indicators to assess market conditions: ADX, Bollinger Bands, and RSI. When the ADX is below 20 and the price remains within Bollinger Bands while RSI stays between 45-55, the market is considered sideways. This is visually represented by a yellow chart background.
In contrast, a strong trend is identified when ADX exceeds 25, accompanied by price breaking out of Bollinger Bands or RSI crossing overbought (70) or oversold (30) levels. The chart background turns blue to signal this market state, providing traders with an immediate visual cue about current market dynamics.
Why it may be useful
Identifying market conditions is crucial for traders to adapt their strategies and manage risk effectively. By distinguishing between sideways and trending markets, traders can make more informed decisions about entry and exit points, reducing the likelihood of false signals and potential losses.
The tool's visual indicators and color-coded backgrounds provide an intuitive way to quickly understand market behavior. This helps traders avoid entering trades during low-probability periods and focus on markets with clearer directional momentum, ultimately improving overall trading performance and decision-making.
When to explore it
This tool is most effective in markets with clear technical patterns and when traders want to avoid range-bound or choppy market conditions. It works best for traders seeking to identify precise market states before entering trades, particularly in more liquid and actively traded markets.
The signal is particularly useful for day traders and swing traders who need to quickly assess market momentum and volatility. By providing clear visual cues and combining multiple indicators, the tool helps traders make more strategic decisions about when to enter or exit positions based on market conditions.
Keep exploring
What we’ve verified
Access, alerts and repainting behaviour have not been independently verified for this indicator. Check the creator’s current publication and settings.
General descriptions and classifications are recovered research. Verified details above identify the specific checks we have completed. Check the creator’s current publication for later changes.


