
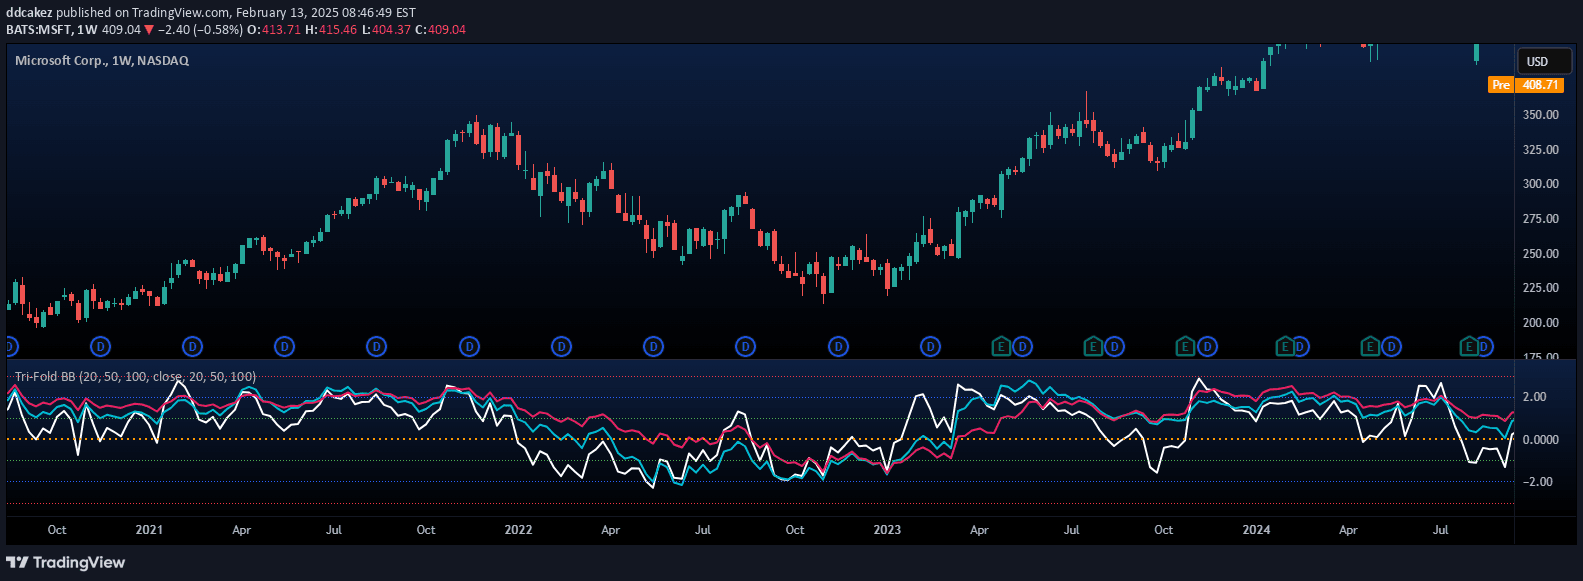
Tri-Fold BB is a multi-length Bollinger Bands indicator that assesses trend strength across short, mid, and long-term timeframes by tracking price relative to standard deviations.
Explore complementary indicator rolesHow it works
The Tri-Fold BB indicator utilizes three Bollinger Bands with different lengths: 20, 50, and 100 periods. It plots an asset's price relative to these bands' standard deviations, allowing traders to understand price movement across multiple timeframes simultaneously. Each band represents a different trend perspective, with shorter lengths showing more immediate price actions and longer lengths providing broader trend context.
By comparing how price interacts with these different-length Bollinger Bands, traders can gain insights into trend strength and potential momentum shifts. The indicator also includes Hull Moving Averages (HMAs) alongside each Bollinger Band, offering additional analytical flexibility for developing trading strategies.
Why it may be useful
The Tri-Fold BB provides a comprehensive view of trend dynamics by examining price movement across multiple timeframe lengths. This multi-dimensional approach helps traders understand not just current price action, but how that action relates to short, medium, and long-term trend contexts. By visualizing price relative to different standard deviation bands, traders can make more informed decisions about potential trend strength and potential reversals.
Unlike single-length indicators, this approach offers a more nuanced perspective on market movements. Traders can better assess whether a price movement is significant across different trend perspectives, reducing the likelihood of misinterpreting short-term fluctuations as meaningful trend changes.
When to explore it
The Tri-Fold BB is most effective in markets with clear trending characteristics, where price movements show consistent directional momentum. It works particularly well in assets with sufficient volatility, allowing the standard deviation bands to provide meaningful insights into price behavior. Traders should consider using this indicator in markets like forex, stocks, and cryptocurrencies that exhibit regular trending patterns.
This indicator is especially useful during periods of potential trend initiation or reversal, where understanding multi-timeframe momentum can provide critical insights. Traders should combine the Tri-Fold BB with other confirmation indicators to validate signals and reduce false positives. It's particularly valuable for traders seeking a holistic view of market dynamics across different time horizons.
Keep exploring
What we’ve verified
Access, alerts and repainting behaviour have not been independently verified for this indicator. Check the creator’s current publication and settings.
General descriptions and classifications are recovered research. Verified details above identify the specific checks we have completed. Check the creator’s current publication for later changes.



