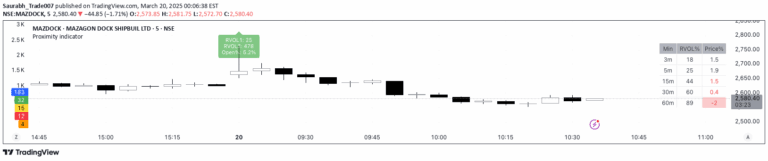
A comprehensive trading signal that combines trend, momentum, and volatility indicators to identify potential entry and exit points in financial markets using EMA, RSI, and ATR.
Explore complementary indicator rolesHow it works
The trading signal utilizes three key technical indicators to generate comprehensive market insights. The 50-period Exponential Moving Average (EMA) determines the overall market trend by identifying whether prices are above or below the moving average line.
The 14-period Relative Strength Index (RSI) measures momentum by identifying overbought and oversold conditions, while the Average True Range (ATR) assesses market volatility. These indicators work together to create precise entry and exit signals, filtering out low-quality trade opportunities and focusing on high-probability setups.
Why it may be useful
This multi-dimensional trading signal provides traders with a robust framework for making informed decisions by combining trend, momentum, and volatility analysis. By integrating different technical indicators, traders can develop a more comprehensive understanding of market dynamics and reduce the risks associated with single-indicator strategies.
The signal's holistic approach helps traders identify high-probability trade setups, manage risk more effectively, and create a disciplined trading methodology that goes beyond simplistic market interpretations.
When to explore it
The trading signal is most effective in markets with clear trend directions and sufficient volatility, making it ideal for day and swing trading scenarios. Traders should prioritize using this signal in liquid markets with consistent price movements, such as major forex pairs, stock indices, and actively traded commodities.
It is particularly useful during periods of moderate market volatility, where trends are establishing themselves and momentum indicators can provide meaningful insights. Traders should combine this signal with additional confirmation methods and always implement proper risk management techniques.
Keep exploring
What we’ve verified
Access, alerts and repainting behaviour have not been independently verified for this indicator. Check the creator’s current publication and settings.
General descriptions and classifications are recovered research. Verified details above identify the specific checks we have completed. Check the creator’s current publication for later changes.