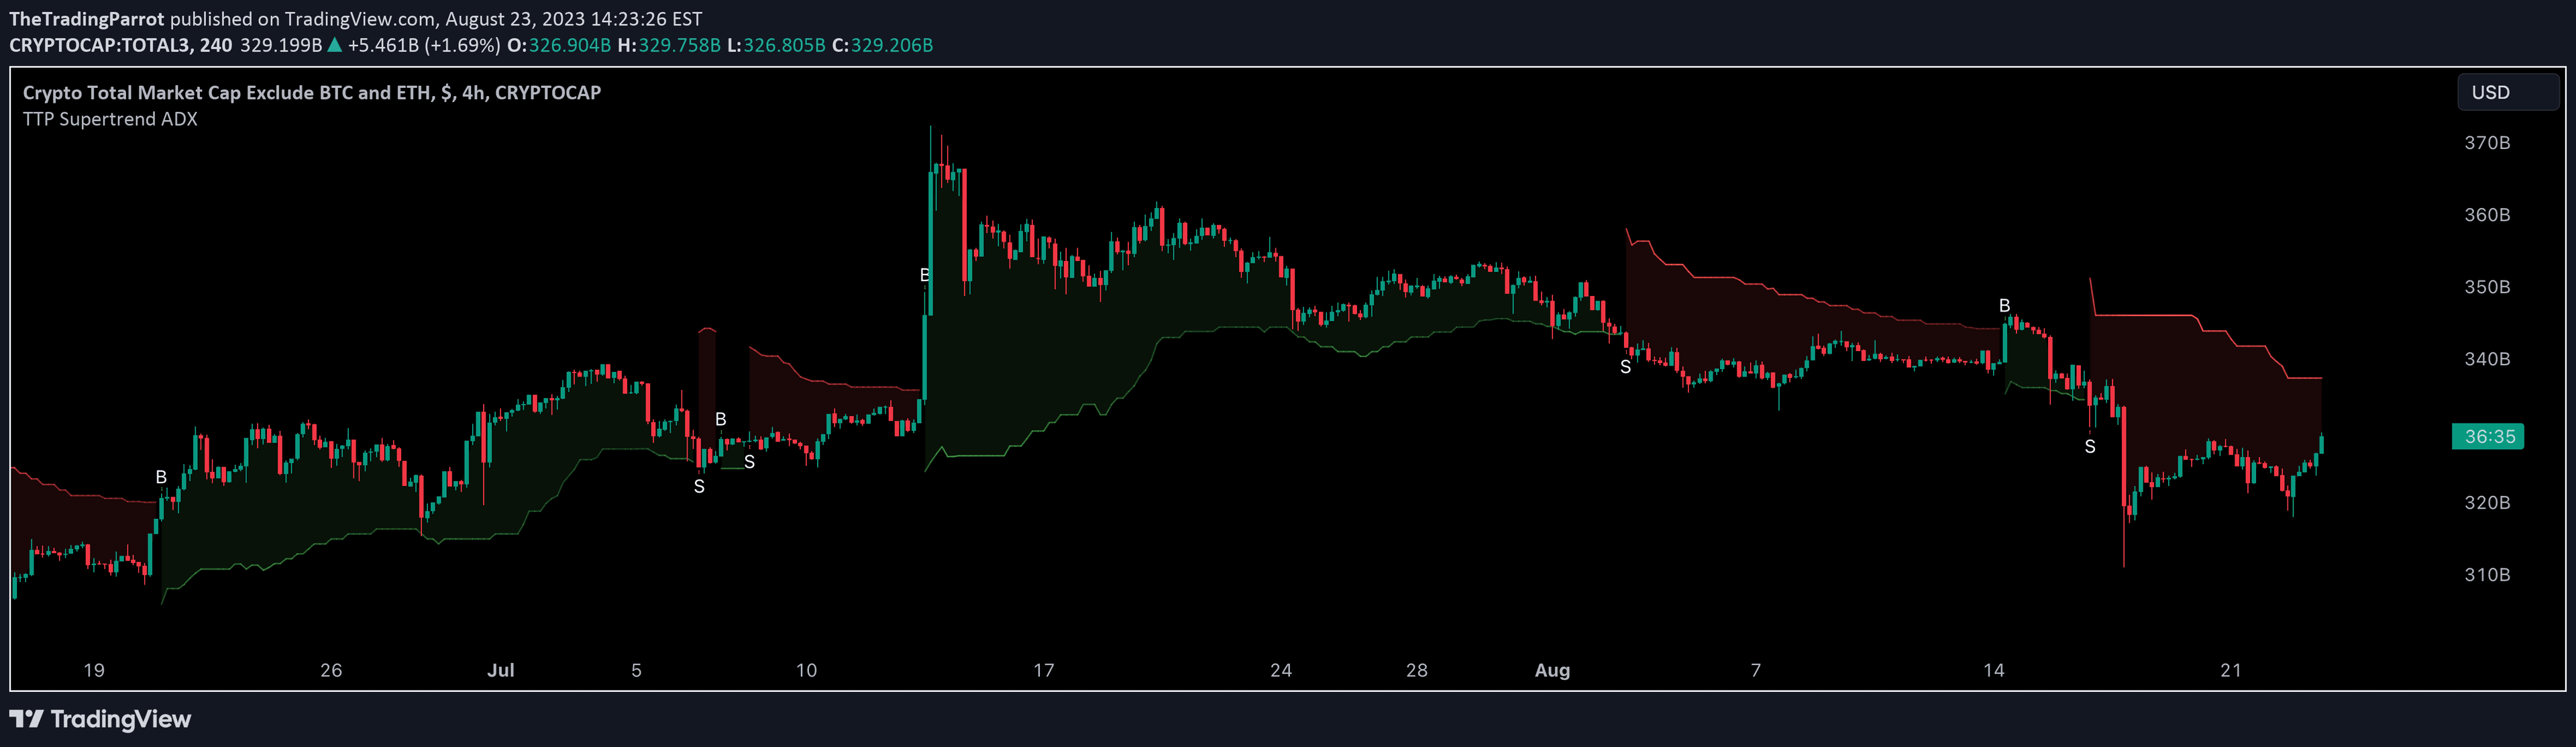
An enhanced Supertrend indicator that uses RSI to validate trend signals, dynamically adjusting color and opacity to indicate trend strength and momentum alignment.
Explore complementary indicator rolesHow it works
The indicator calculates the Supertrend line using Average True Range (ATR), similar to the classic version, but introduces an innovative RSI filter to validate trend signals. It dynamically changes the Supertrend line's color and opacity based on the Relative Strength Index, providing visual cues about trend strength and momentum.
When the price is in an uptrend, the line turns green if RSI is above the threshold, with color intensity reflecting how far RSI is from that point. In a downtrend, the line turns red when RSI is below the threshold, with similar dynamic color representation. This approach helps traders quickly understand not just trend direction, but also the momentum supporting that trend.
Why it may be useful
Traditional trend indicators often generate false signals, leading traders to make poor decisions based on incomplete information. By integrating RSI momentum analysis, this enhanced Supertrend provides a more nuanced view of market conditions, reducing the likelihood of entering trades without sufficient confirmation.
The dynamic color and opacity mechanism allows traders to visually gauge trend reliability at a glance. When RSI strongly supports the trend, colors are vivid and saturated, while uncertain trends appear more transparent, helping traders make more informed and conservative trading decisions.
When to explore it
This indicator is most effective in trending markets with clear momentum, where price is moving steadily in one direction and RSI confirms the underlying strength. It works particularly well in markets with moderate volatility, where trend signals are not too erratic or unpredictable.
Traders should consider using this indicator across multiple timeframes, from short-term scalping to longer swing trades. It is especially useful when combined with other technical analysis tools, helping to filter out weak signals and focus on high-probability trading opportunities with strong momentum alignment.
Keep exploring
What we’ve verified
Access, alerts and repainting behaviour have not been independently verified for this indicator. Check the creator’s current publication and settings.
General descriptions and classifications are recovered research. Verified details above identify the specific checks we have completed. Check the creator’s current publication for later changes.