
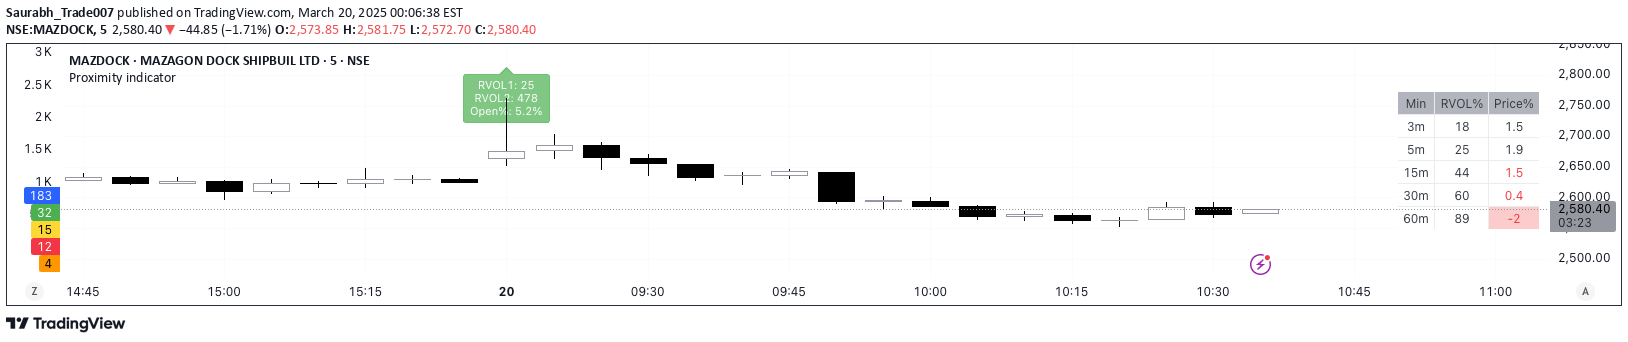
A comprehensive trading signal that analyzes price dynamics by tracking proximity to 52-week levels, moving average deviations, daily range volatility, and short-term price rebounds.
Explore complementary indicator rolesHow it works
The signal calculates multiple metrics by analyzing price data over different timeframes, starting with a 52-week price range assessment. It identifies the highest and lowest daily prices across 252 trading days and compares them to the current closing price, expressing the relationship as a percentage.
Additionally, the signal examines moving average deviations using either Simple or Exponential Moving Averages and tracks market volatility through a 14-day Average Daily Range percentage. It also measures the price rebound from the lowest point in the past three months, providing a comprehensive view of price movement and trend dynamics.
Why it may be useful
This signal offers traders a multi-dimensional perspective on market behavior by integrating trend, momentum, and volatility metrics into a single framework. By providing insights across different timeframes and price dynamics, it helps traders understand the complex interactions between various market forces and potential price movements.
The comprehensive approach allows traders to make more informed decisions by revealing nuanced details about a stock's current market position. It helps identify potential trend strengths, momentum shifts, and volatility changes that might not be apparent when using individual indicators in isolation.
When to explore it
The signal is most effective during periods of market transition or when traders need a holistic view of price dynamics across multiple timeframes. It works well in markets with clear trending characteristics, where price movements show consistent directional momentum and identifiable support/resistance levels.
Traders can leverage this signal during breakout scenarios, trend confirmations, and when assessing potential trend reversals. It is particularly useful for analyzing stocks with moderate to high volatility and for traders seeking a comprehensive, integrated approach to market analysis.
Keep exploring
What we’ve verified
Access, alerts and repainting behaviour have not been independently verified for this indicator. Check the creator’s current publication and settings.
General descriptions and classifications are recovered research. Verified details above identify the specific checks we have completed. Check the creator’s current publication for later changes.


