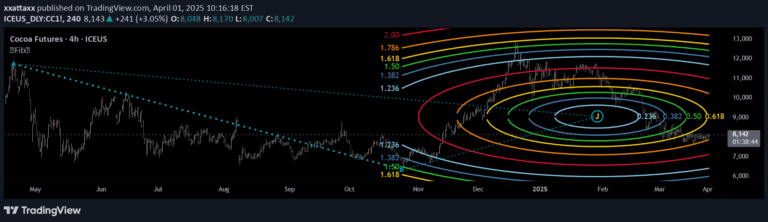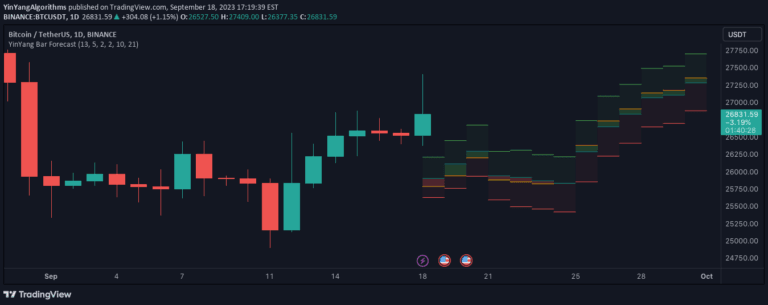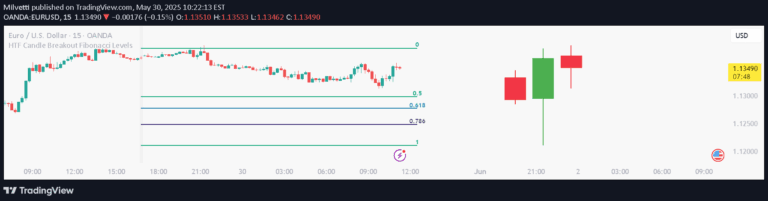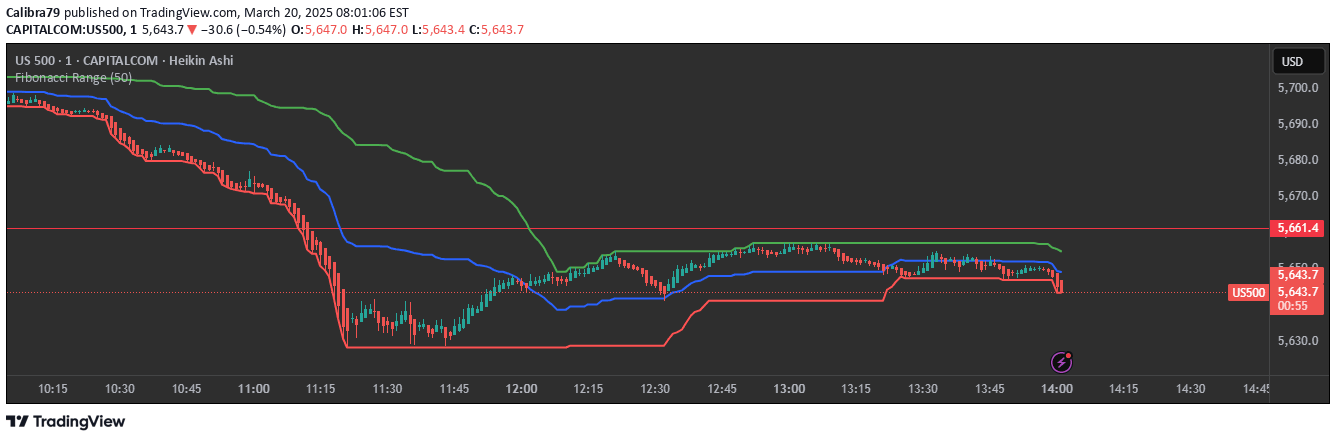
Fibonacci Range 50 Indicator helps traders identify potential price reversal zones and breakout levels by utilizing the 50% Fibonacci retracement level as a dynamic midpoint for technical analysis.
Explore complementary indicator rolesHow it works
The Fibonacci Range 50 Indicator automatically detects a significant price range by identifying the highest and lowest points of a specific trading session. It calculates and plots the critical 50% Fibonacci retracement level within this range, serving as a dynamic midpoint.
Traders can observe how price interacts with this level to gain insights into potential market movements. The indicator analyzes price rejection or breakout scenarios around the 50% level. It provides visual cues about potential trend continuation, reversal, or breakout opportunities without requiring manual Fibonacci drawing
Why it may be useful
This indicator simplifies complex Fibonacci analysis by automatically calculating key reference levels for traders. It helps identify high-probability trading opportunities by highlighting potential pivot zones where price might reverse or continue its trend.
The objective measurement reduces emotional decision-making and provides a systematic approach to technical analysis. Traders can use this tool to improve trade entry precision, set more accurate stop-loss levels, and define potential profit targets. The indicator's versatility across different markets makes it a valuable tool for various trading strategies
When to explore it
The Fibonacci Range 50 Indicator works best during periods of clear market structure and defined price ranges. It is most effective in markets with moderate volatility where price tends to respect technical levels. Intraday traders can utilize this indicator for short-term setups, while swing traders can apply it to identify longer-term turning points.
The indicator is particularly useful during consolidation phases, breakout scenarios, and when traders want to confirm potential trend reversals. It performs optimally when combined with complementary indicators like moving averages or momentum oscillators
Keep exploring
What we’ve verified
Access, alerts and repainting behaviour have not been independently verified for this indicator. Check the creator’s current publication and settings.
General descriptions and classifications are recovered research. Verified details above identify the specific checks we have completed. Check the creator’s current publication for later changes.