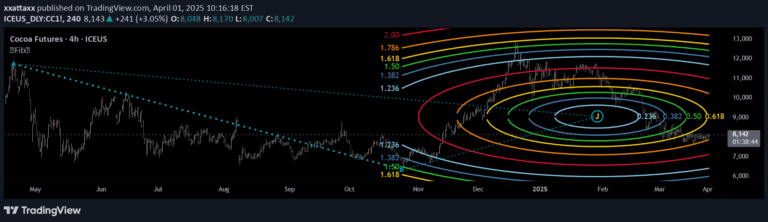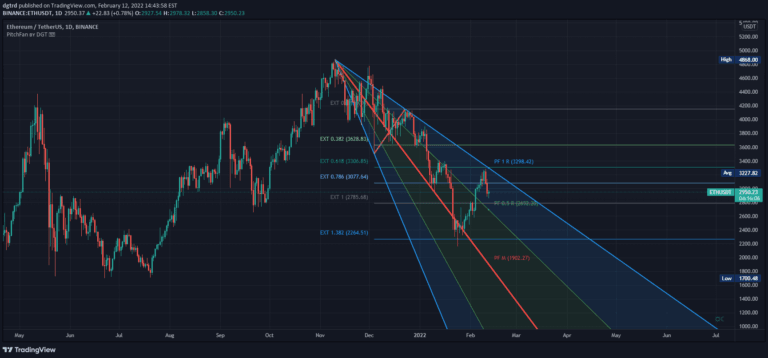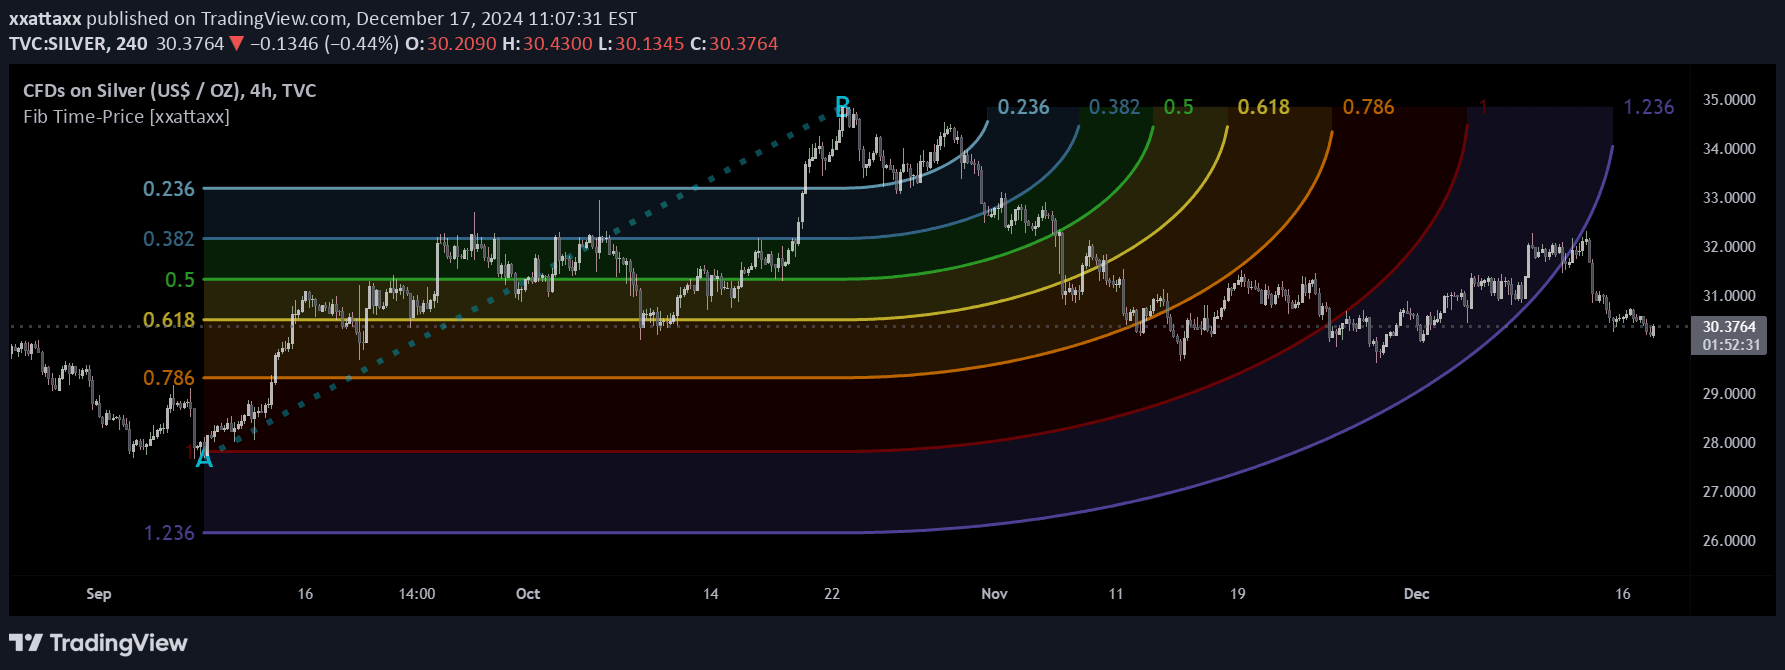
Fibonacci Time-Price Zones is an advanced indicator that combines Fibonacci ratios with time and price analysis, offering multiple geometric visualization methods to identify market turning points.
Explore complementary indicator rolesHow it works
The indicator creates Fibonacci-based geometric visualizations using four distinct shapes: circular, orthogonal, sloped, and horizontal. It calculates Fibonacci levels by analyzing the relationship between price and time dimensions.
Users define start and end points on the chart, which become anchor points for the analysis. The tool projects potential support and resistance zones by applying Fibonacci ratios across these points. Each shape option provides a unique perspective on market structure, incorporating mathematical principles of market movement
Why it may be useful
Fibonacci Time-Price Zones advances traditional technical analysis by integrating time into price-based calculations. It reveals market structure that traditional tools might miss by showing how price movements respect both temporal and price-based ratios.
The multi-dimensional approach allows traders to observe market behavior through different geometric lenses. By combining multiple visualization methods, the indicator provides a comprehensive framework for understanding market dynamics. This approach helps traders identify potential turning points more precisely than standard Fibonacci tools
When to explore it
This indicator works best during trending markets with clear price swings and established support/resistance levels. It is most effective when analyzing higher timeframe charts that reveal more significant market patterns.
Traders should use it in conjunction with other technical analysis tools to confirm signals. It is particularly useful for identifying potential reversal zones and continuation patterns. The tool is most valuable for traders seeking a more nuanced understanding of market geometry and time-price relationships
Keep exploring
What we’ve verified
Access, alerts and repainting behaviour have not been independently verified for this indicator. Check the creator’s current publication and settings.
General descriptions and classifications are recovered research. Verified details above identify the specific checks we have completed. Check the creator’s current publication for later changes.