Fibonacci Time-Price Zones
Fibonacci Time-Price Zones is an advanced indicator that combines Fibonacci ratios with time and price analysis, offering multiple geometric visualization methods to identify market turning points.
Explore 11,183 indicators. Filter beyond the obvious.
Discover the tools that fit the way you trade.
11,183 tools to explore
Fibonacci Time-Price Zones is an advanced indicator that combines Fibonacci ratios with time and price analysis, offering multiple geometric visualization methods to identify market turning points.
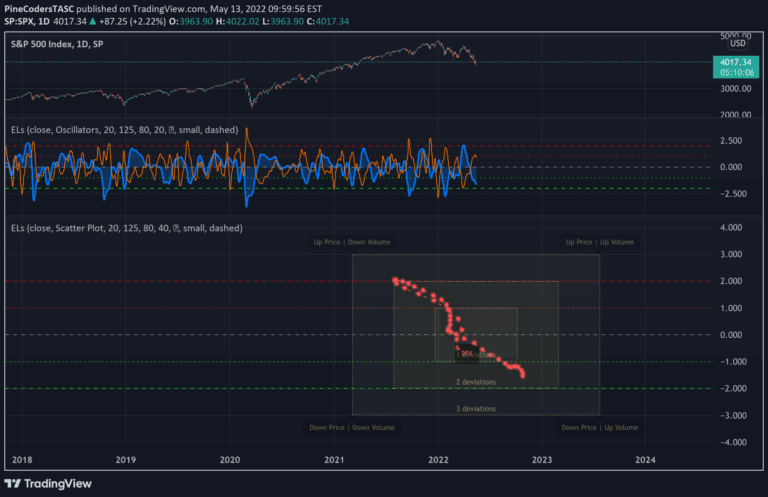
The Ehlers Loops indicator reveals price and volume dynamics through a quadrant-based visual representation, helping traders understand market momentum and potential trend reversals.
A unique trading tool that overlays momentum oscillators within a logarithmic regression channel, providing dynamic insights into price trends and momentum positioning.
Dynamic grid trading indicator that uses parabolic curves to create adaptive support and resistance levels across different market conditions and trends.
Ehlers Loops is an advanced visualization technique that compares filtered and scaled price and volume data to reveal potential market conditions and trading insights.
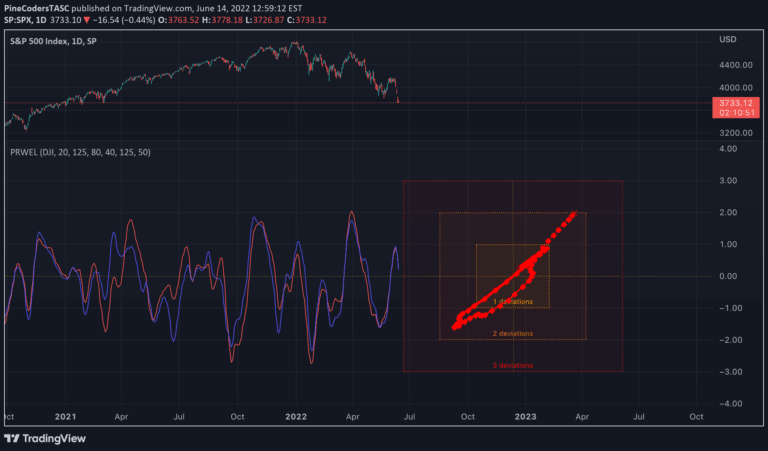
Ehlers Loops is a pairs rotation trading method that compares and analyzes the relative performance of two securities by filtering and scaling their price movements.
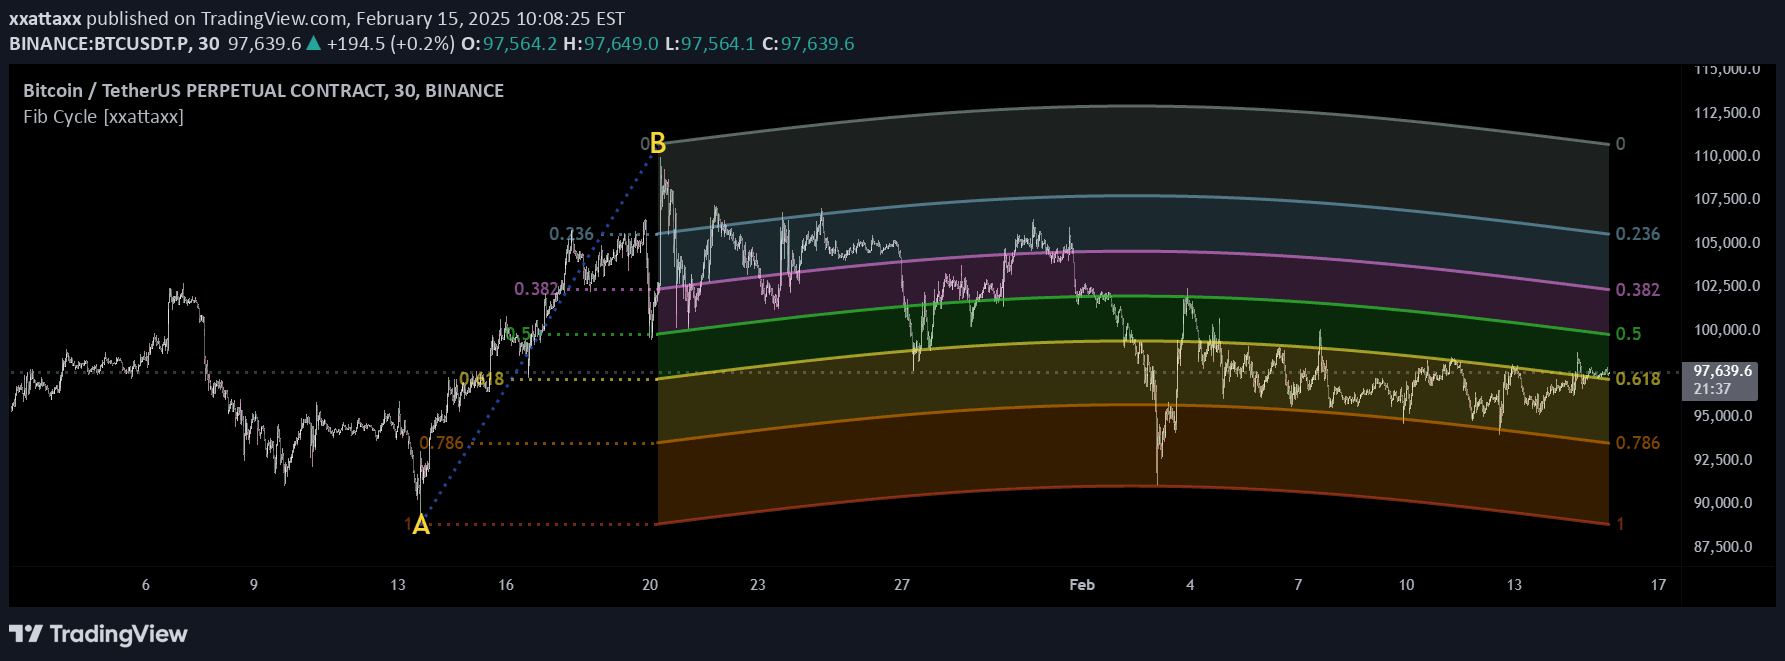
A dynamic Fibonacci analysis tool that transforms traditional retracement levels into wave-based cycles, offering a non-linear approach to understanding market structure and price movements.
An advanced indicator measuring moving average slope, helping traders identify trend changes and potential reversals by analyzing the curve's directional momentum and pivot points.
Likes, views, and comments are historical TradingView snapshots. They describe attention, not trading performance.