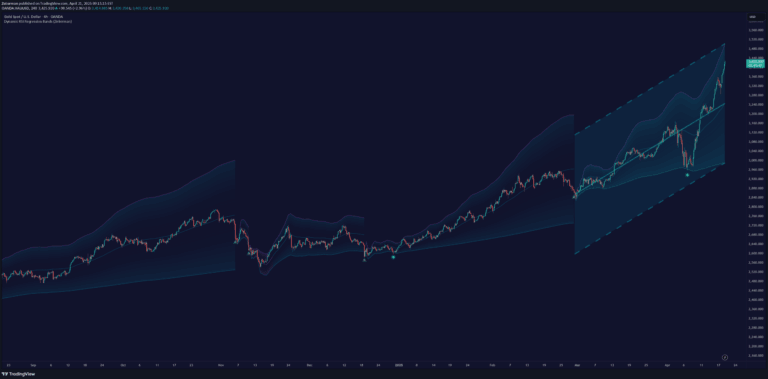
Dynamic grid trading indicator that uses parabolic curves to create adaptive support and resistance levels across different market conditions and trends.
Explore complementary indicator rolesHow it works
The Parabolic Grid Bot creates a dynamic grid system that adapts to price movements using acceleration and curvature parameters. By adjusting these settings, traders can generate horizontal, linear, or curved grid structures that respond to market conditions.
The indicator calculates grid levels based on the selected start point, with zones colored to indicate potential buy and sell areas. It uses trigger and confirmation methods to generate signals, allowing traders to identify potential entry and exit points across different market environments.
Why it may be useful
The Parabolic Grid Bot addresses traditional grid trading limitations by introducing flexibility and adaptability to changing market dynamics. It provides traders with a sophisticated tool that can adjust to trending and ranging markets, offering more nuanced insights into potential support and resistance levels.
By incorporating acceleration, curvature, and sentiment analysis, the indicator helps traders visualize market cycles and potential turning points more effectively than traditional static grid systems. This approach enables more dynamic and responsive trading strategies across different asset classes and timeframes.
When to explore it
The Parabolic Grid Bot is most effective in markets with clear trends or those experiencing significant price volatility. It performs exceptionally well when traders want to implement grid trading strategies that can adapt to changing market conditions and capture both trending and mean-reverting price movements.
Traders should consider using this indicator when they need a flexible tool that can transition between horizontal, linear, and curved grid configurations. It is particularly useful for analyzing assets with complex price patterns and for developing sophisticated trading strategies that require dynamic support and resistance level identification.
Keep exploring
What we’ve verified
Access, alerts and repainting behaviour have not been independently verified for this indicator. Check the creator’s current publication and settings.
General descriptions and classifications are recovered research. Verified details above identify the specific checks we have completed. Check the creator’s current publication for later changes.