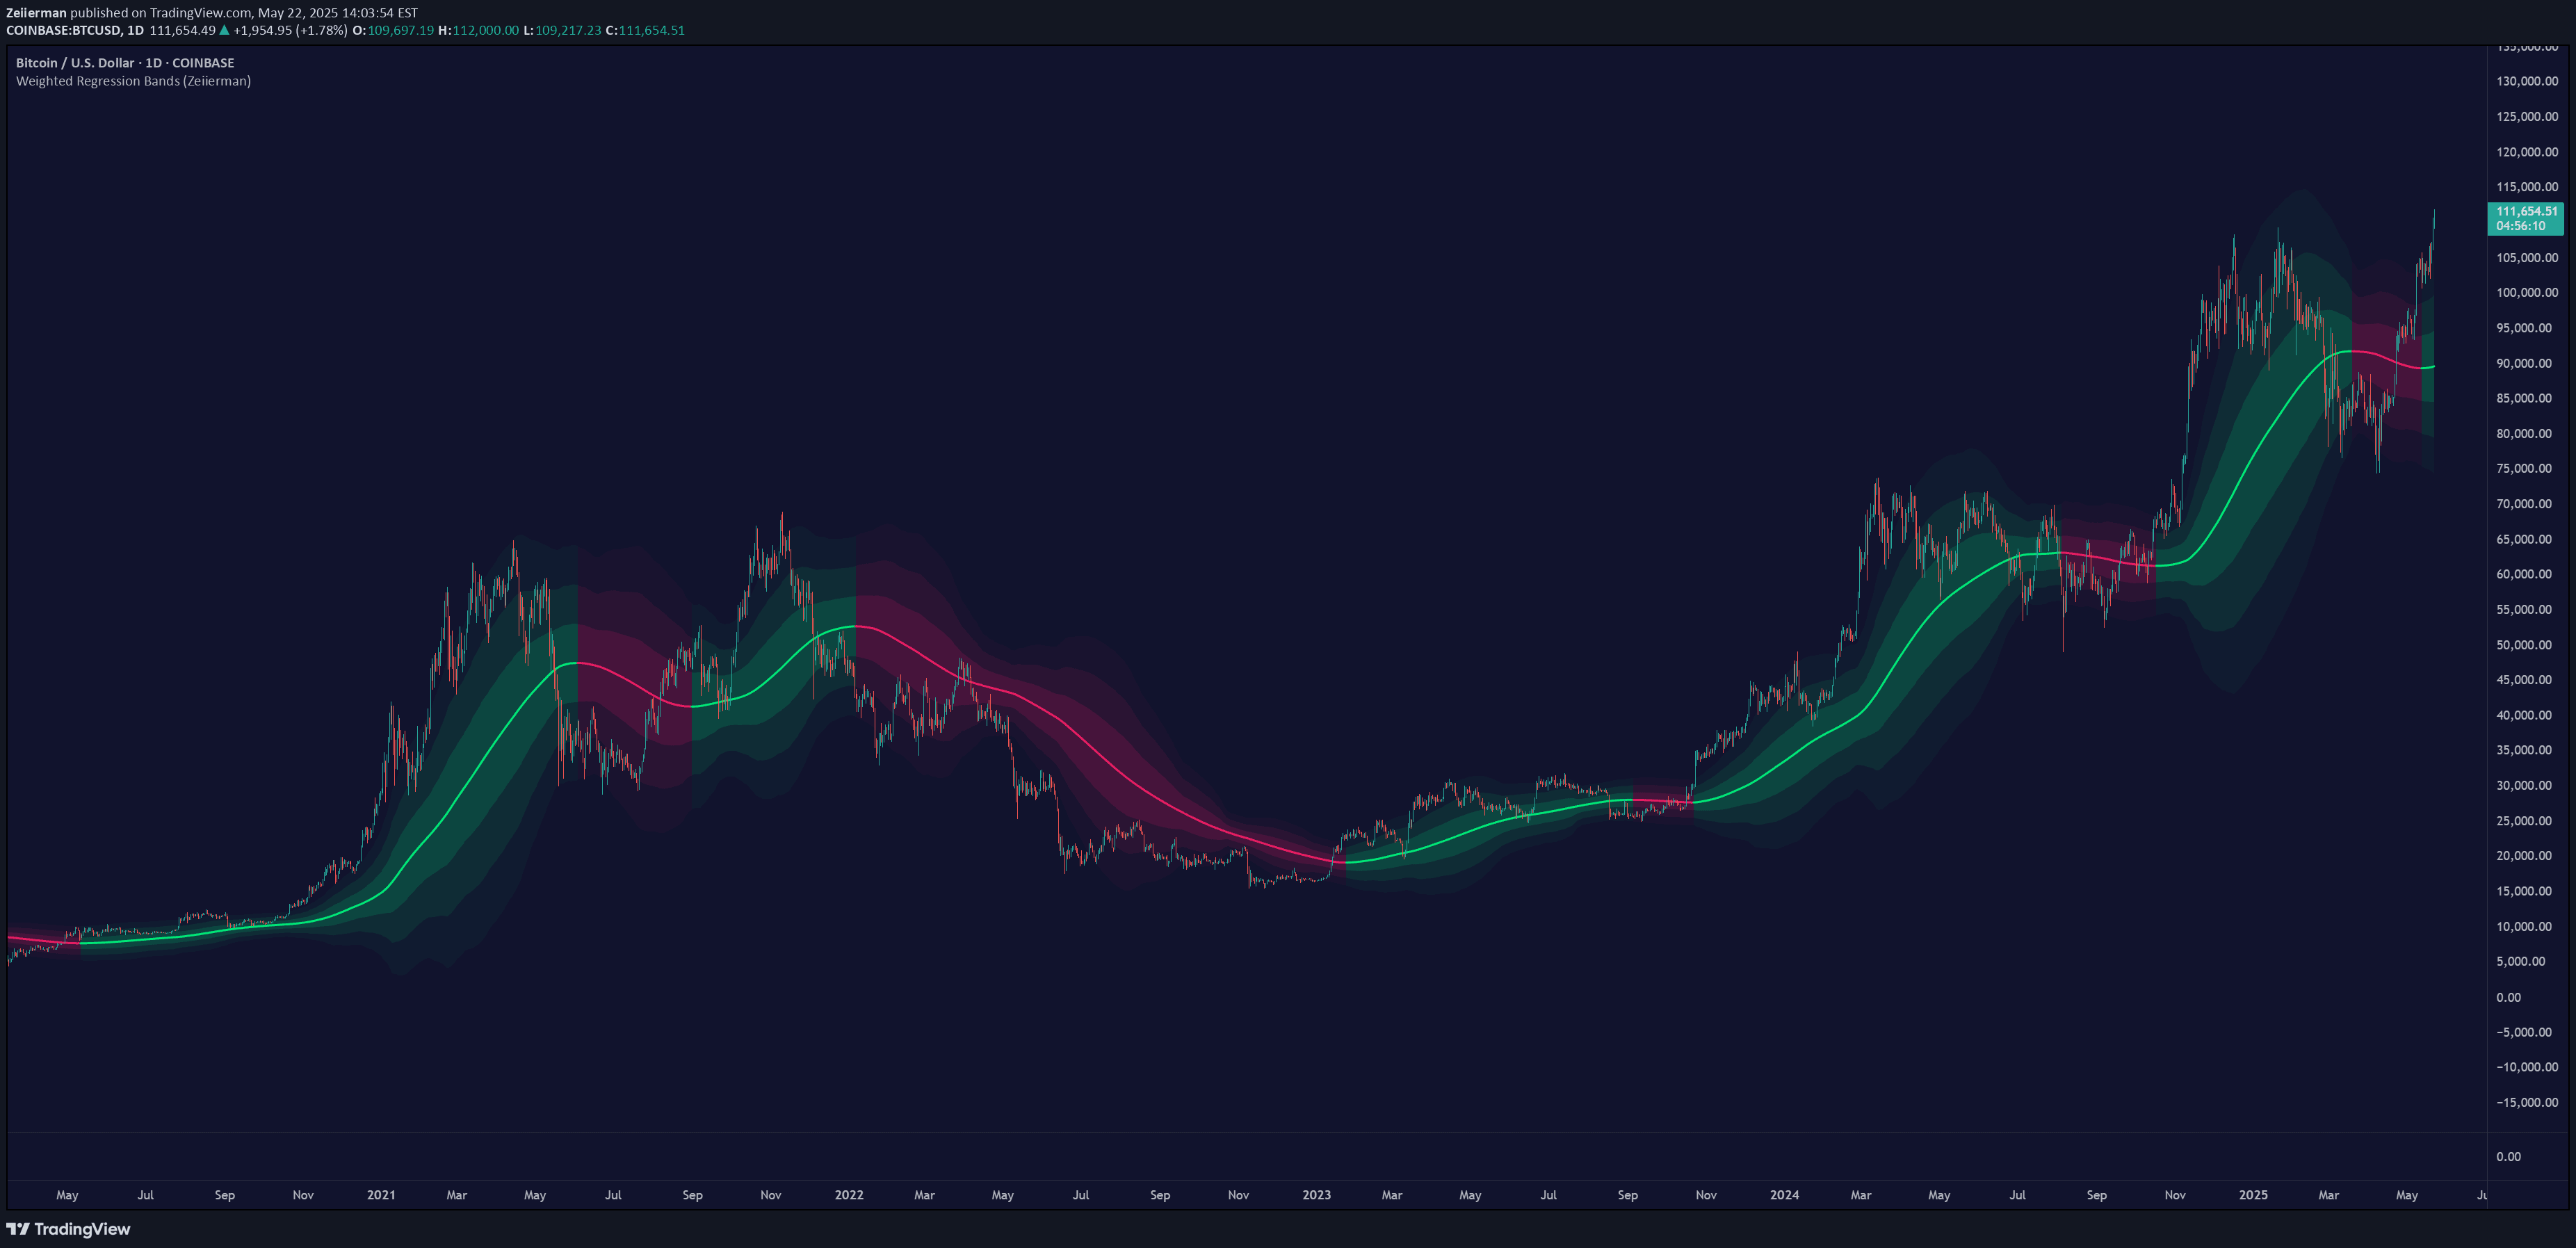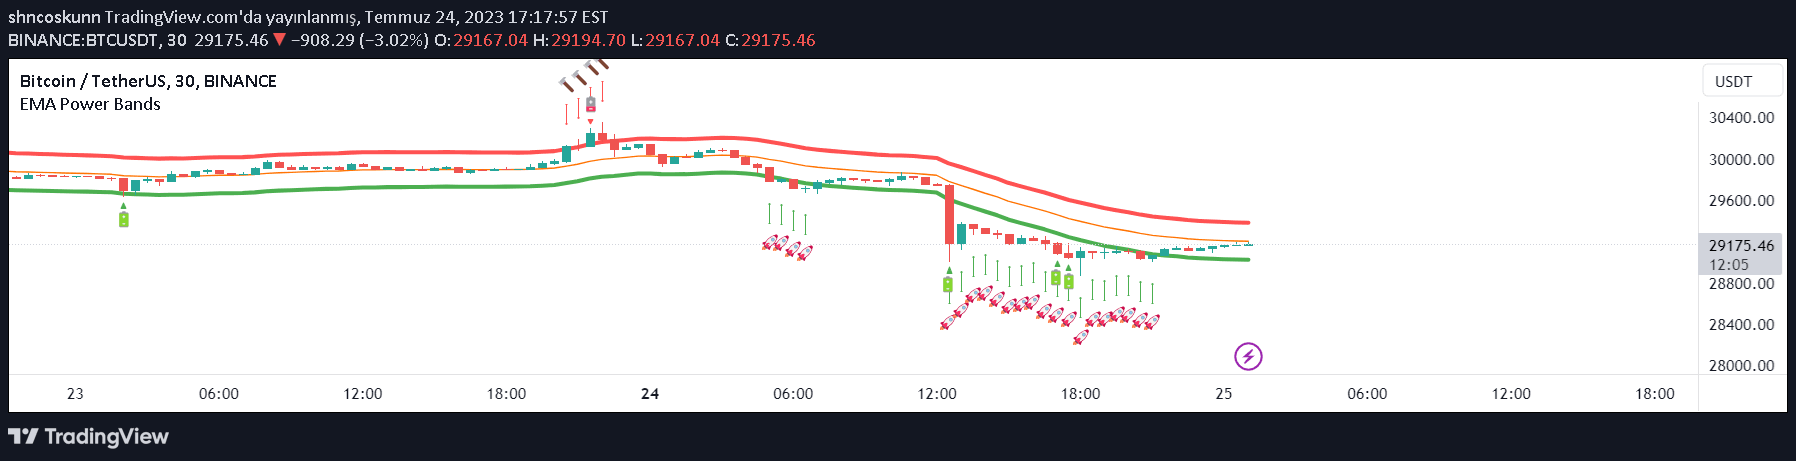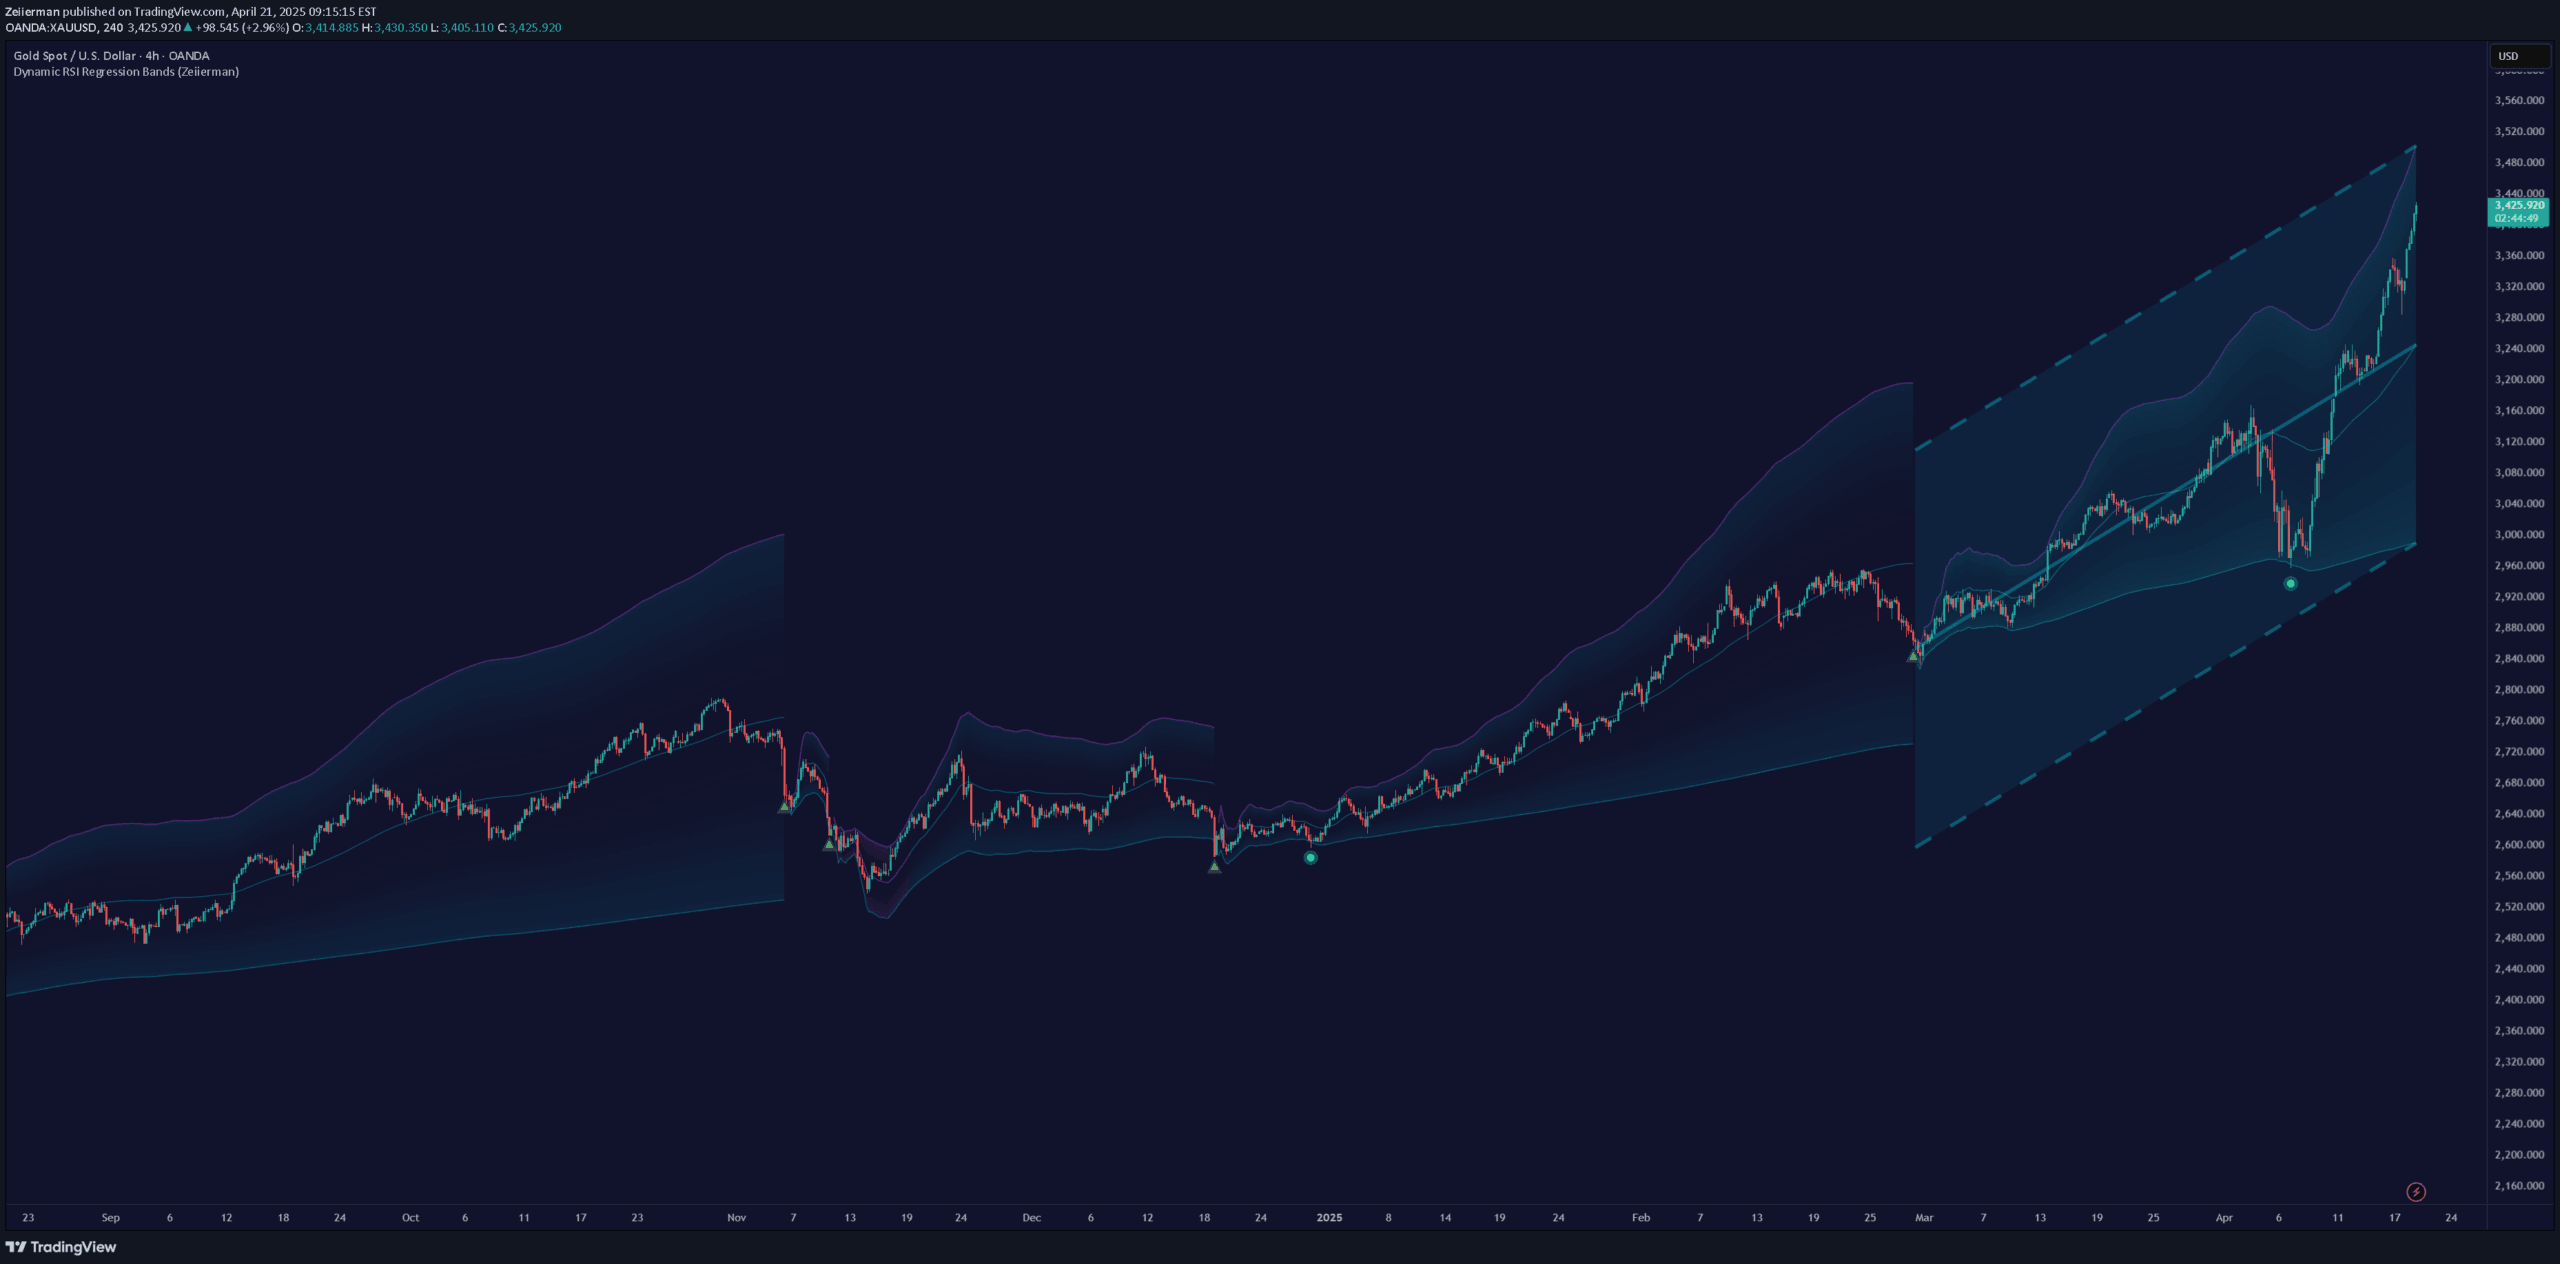
A dynamic RSI-based regression channel that adapts to market momentum by resetting its trend analysis when RSI crosses overbought or oversold levels, revealing potential trend shifts.
Explore complementary indicator rolesHow it works
The Dynamic RSI Regression Bands continuously monitor RSI levels, resetting the regression channel when RSI crosses predefined overbought or oversold thresholds. Each reset creates a new linear regression line from that point forward, with the lookback growing until reaching a maximum length.
Standard deviation bands are plotted around the regression line, creating dynamic volatility envelopes that adapt to changing market conditions. The system tracks price interactions with these bands, marking potential rejection points and momentum shifts
Why it may be useful
This indicator provides traders with a responsive, adaptive tool for analyzing market momentum and potential trend reversals. By dynamically recalibrating based on RSI extremes, it offers insights into emotional market peaks and potential regime changes.
The regression bands help visualize volatility and identify potential breakout or reversal zones. Rejection markers further enhance trading decisions by highlighting failed price movements and areas of market absorption
When to explore it
The Dynamic RSI Regression Bands work best in markets with clear momentum shifts and identifiable trend structures. It's particularly effective in identifying potential trend reversals, especially after significant RSI level crossovers.
Traders can use this tool in ranging and trending markets to spot volatility extremes, potential entry points, and momentum changes. It's most valuable when combined with other technical analysis tools to confirm signals and reduce false positive interpretations
Keep exploring
What we’ve verified
Access, alerts and repainting behaviour have not been independently verified for this indicator. Check the creator’s current publication and settings.
General descriptions and classifications are recovered research. Verified details above identify the specific checks we have completed. Check the creator’s current publication for later changes.