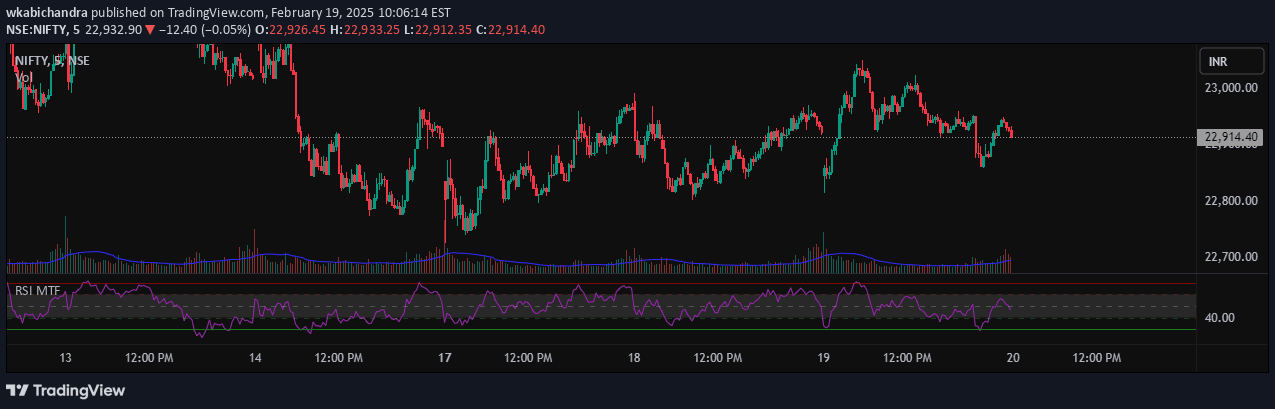
An adaptive T3 moving average that dynamically adjusts its smoothing length using RSI, creating a responsive trend-following indicator that adapts to market volatility and momentum.
Explore complementary indicator rolesHow it works
The RSI-Adaptive T3 combines two sophisticated techniques: the T3 moving average and a dynamic length engine powered by RSI. It uses a six-stage exponential moving average (EMA) cascade with a volume factor to create a smoothed trend line that adjusts its sensitivity based on current market conditions.
The indicator calculates the RSI and uses its value to dynamically modify the moving average's length. When the RSI is low (indicating an oversold market), the T3 becomes shorter and more reactive. Conversely, when the RSI is high (indicating an overbought market), the T3 becomes longer and smoother, creating an intelligent feedback loop between price momentum and trend sensitivity.
Why it may be useful
Traditional moving averages often struggle with lag and responsiveness, making it challenging to capture real-time market dynamics. The RSI-Adaptive T3 solves this problem by creating an intelligent, self-adjusting trend indicator that can quickly adapt to changing market conditions and volatility.
By integrating RSI momentum information directly into the trend calculation, traders gain a more nuanced view of market behavior. The indicator provides visual cues about trend direction, momentum shifts, and potential entry or exit points, making it a powerful tool for traders seeking a more dynamic and responsive trend-following approach.
When to explore it
The RSI-Adaptive T3 is most effective during periods of market transition and varying volatility. It excels in identifying trend changes, especially during consolidation phases or when markets are preparing to break out of tight trading ranges. Traders can use this indicator to spot potential trend reversals and momentum shifts across different timeframes.
The adaptive nature of this indicator makes it particularly useful in markets that experience frequent volatility changes, such as cryptocurrency, forex, or stocks during earnings seasons. It is especially valuable for traders who want a more responsive trend indicator that can quickly adjust to changing market tempos and provide early signals of potential trend developments.
Keep exploring
What we’ve verified
Access, alerts and repainting behaviour have not been independently verified for this indicator. Check the creator’s current publication and settings.
General descriptions and classifications are recovered research. Verified details above identify the specific checks we have completed. Check the creator’s current publication for later changes.