Hull Suite
Hull Moving Average (HMA) is an advanced technical indicator designed to minimize lag and provide smooth trend visualization across multiple variants with customizable settings.
Explore 11,183 indicators. Filter beyond the obvious.
Discover the tools that fit the way you trade.
11,183 tools to explore
Hull Moving Average (HMA) is an advanced technical indicator designed to minimize lag and provide smooth trend visualization across multiple variants with customizable settings.
Laguerre RSI is a noise-reduced momentum indicator using John EHLERS' Laguerre Filter to analyze market trends by tracking price movement smoothness and potential reversals.
A dynamic trend indicator using Zero-Lag Moving Average and EMA to detect market momentum shifts, highlighting trend reversal levels and potential price zones.
A market structure indicator using fractal patterns to detect trend changes, support/resistance levels, and market reversals with adaptive analysis of price movements.
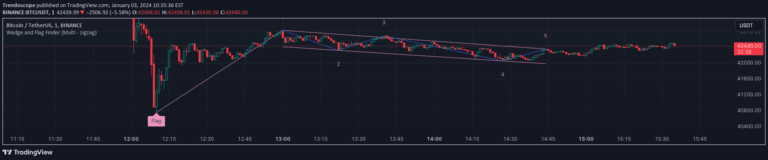
A refined wedge and flag pattern recognition technique using five pivots instead of the standard four, designed to reduce noise and improve pattern identification in trading signals.
Zero Lag Trend Signals is an advanced indicator that eliminates trend detection delays by using zero-lag EMA and volatility bands across multiple timeframes.
A generalized Gaussian filter that smooths price data with variable pole orders, reducing noise and high-frequency market movements using advanced signal processing techniques.
A custom moving average using a beta distribution weighting function that allows traders to control lag and smoothness, offering flexible trend analysis with adjustable parameters.
A dynamic trend analysis tool using Hull-EMA curves that color-codes price bars, plots support/resistance boxes, and identifies high-probability breakout retests for traders.
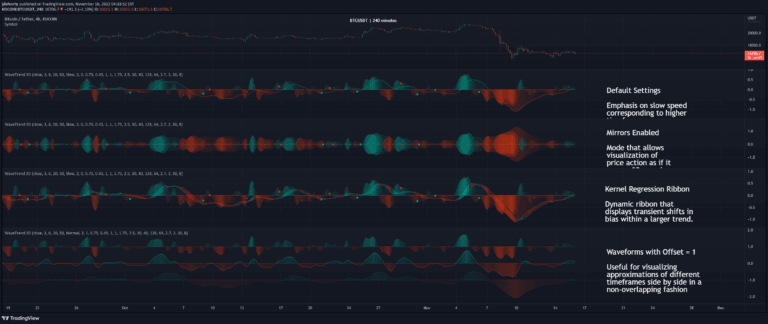
WaveTrend 3D is an advanced oscillator that uses digital signal processing and machine learning techniques to analyze price trends with enhanced precision and multi-timeframe support.
An autoregressive scatter plot forecaster that uses statistical coefficients to predict price movement by analyzing historical trends and creating probabilistic predictions.
Flag Finder is a technical analysis tool that identifies bullish and bearish flag patterns, helping traders detect potential price continuation signals during market trends.
Likes, views, and comments are historical TradingView snapshots. They describe attention, not trading performance.