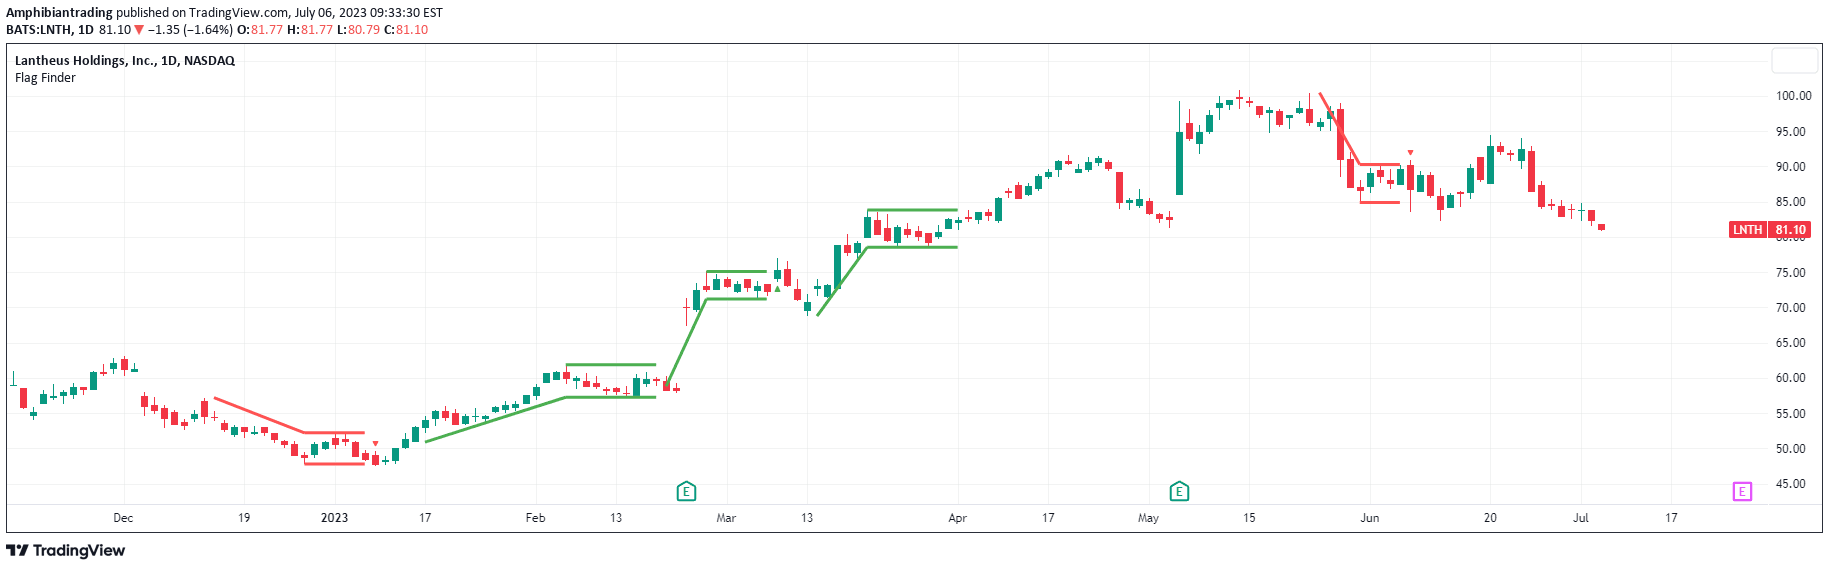
Flag Finder is a technical analysis tool that identifies bullish and bearish flag patterns, helping traders detect potential price continuation signals during market trends.
Explore complementary indicator rolesHow it works
Flag Finder analyzes price movements to detect flag patterns consisting of two key components: the pole and the flag. The pole represents a strong initial price surge or decline with high volume, signaling significant market momentum. The flag is a consolidation period where price temporarily moves sideways or slightly against the initial trend.
Traders look for specific characteristics like pole steepness, flag depth, and volume changes. The indicator allows customization of parameters such as minimum and maximum pole percentage, flag depth, and number of bars. It visually highlights potential flag formations on the chart
Why it may be useful
Flag patterns are crucial for traders because they provide insights into potential trend continuations. By identifying these patterns, traders can anticipate future price movements with higher probability.
The patterns help traders understand market psychology, showing how price consolidates after a strong move before potentially resuming the original trend. Flag patterns offer clear entry and exit points, allowing for more precise trade management. They also help traders gauge market momentum and identify potential breakout opportunities
When to explore it
Flag Finder works best in trending markets with clear directional movements. It is most effective on timeframes that capture meaningful price swings, such as 15-minute to daily charts. The indicator is particularly useful during periods of high market volatility when momentum trades are more likely to succeed.
Traders should use it in conjunction with other technical indicators to confirm signals. It is especially valuable for trading liquid assets with consistent volume. Flag patterns are most reliable in markets showing strong, consistent trends
Keep exploring
What we’ve verified
Access, alerts and repainting behaviour have not been independently verified for this indicator. Check the creator’s current publication and settings.
General descriptions and classifications are recovered research. Verified details above identify the specific checks we have completed. Check the creator’s current publication for later changes.