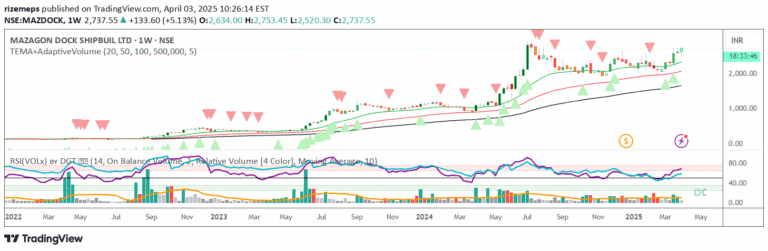
A signal tracking institutional buying activity by identifying tight weekly closes and consecutive up weeks, providing visual indicators of potential market momentum shifts.
Explore complementary indicator rolesHow it works
The signal monitors weekly chart patterns by tracking two primary conditions: three tight weekly closes and five consecutive up weeks. For tight closes, it calculates the percentage difference between weekly closing prices, typically using a default threshold of less than 1.5% variation.
When three tight weekly closes occur, the system generates a visual marker like a circle around the middle close or changes the background color. If five consecutive up weeks are detected, a box is drawn around those weeks' price action, highlighting sustained upward momentum.
Why it may be useful
This signal helps traders identify potential institutional buying activity and sustained market trends by providing clear visual cues about price behavior. By highlighting periods of consistent price action, it offers insights into market sentiment and potential trend strength.
The flexibility of customizable options like color selection and tight close definitions allows traders to adapt the indicator to their specific trading style and preferences, making it a versatile tool for trend identification and analysis.
When to explore it
The signal is most effective for swing traders and investors seeking to identify longer-term trend movements and potential institutional interest in a particular security. It works best in markets with clear directional trends and when used in conjunction with other technical analysis tools.
Traders should be cautious about using this signal in highly volatile or range-bound markets where weekly price movements might not accurately reflect underlying trend strength. It is particularly useful for stocks, indices, and other financial instruments with relatively stable weekly price patterns.
Keep exploring
What we’ve verified
Access, alerts and repainting behaviour have not been independently verified for this indicator. Check the creator’s current publication and settings.
General descriptions and classifications are recovered research. Verified details above identify the specific checks we have completed. Check the creator’s current publication for later changes.