
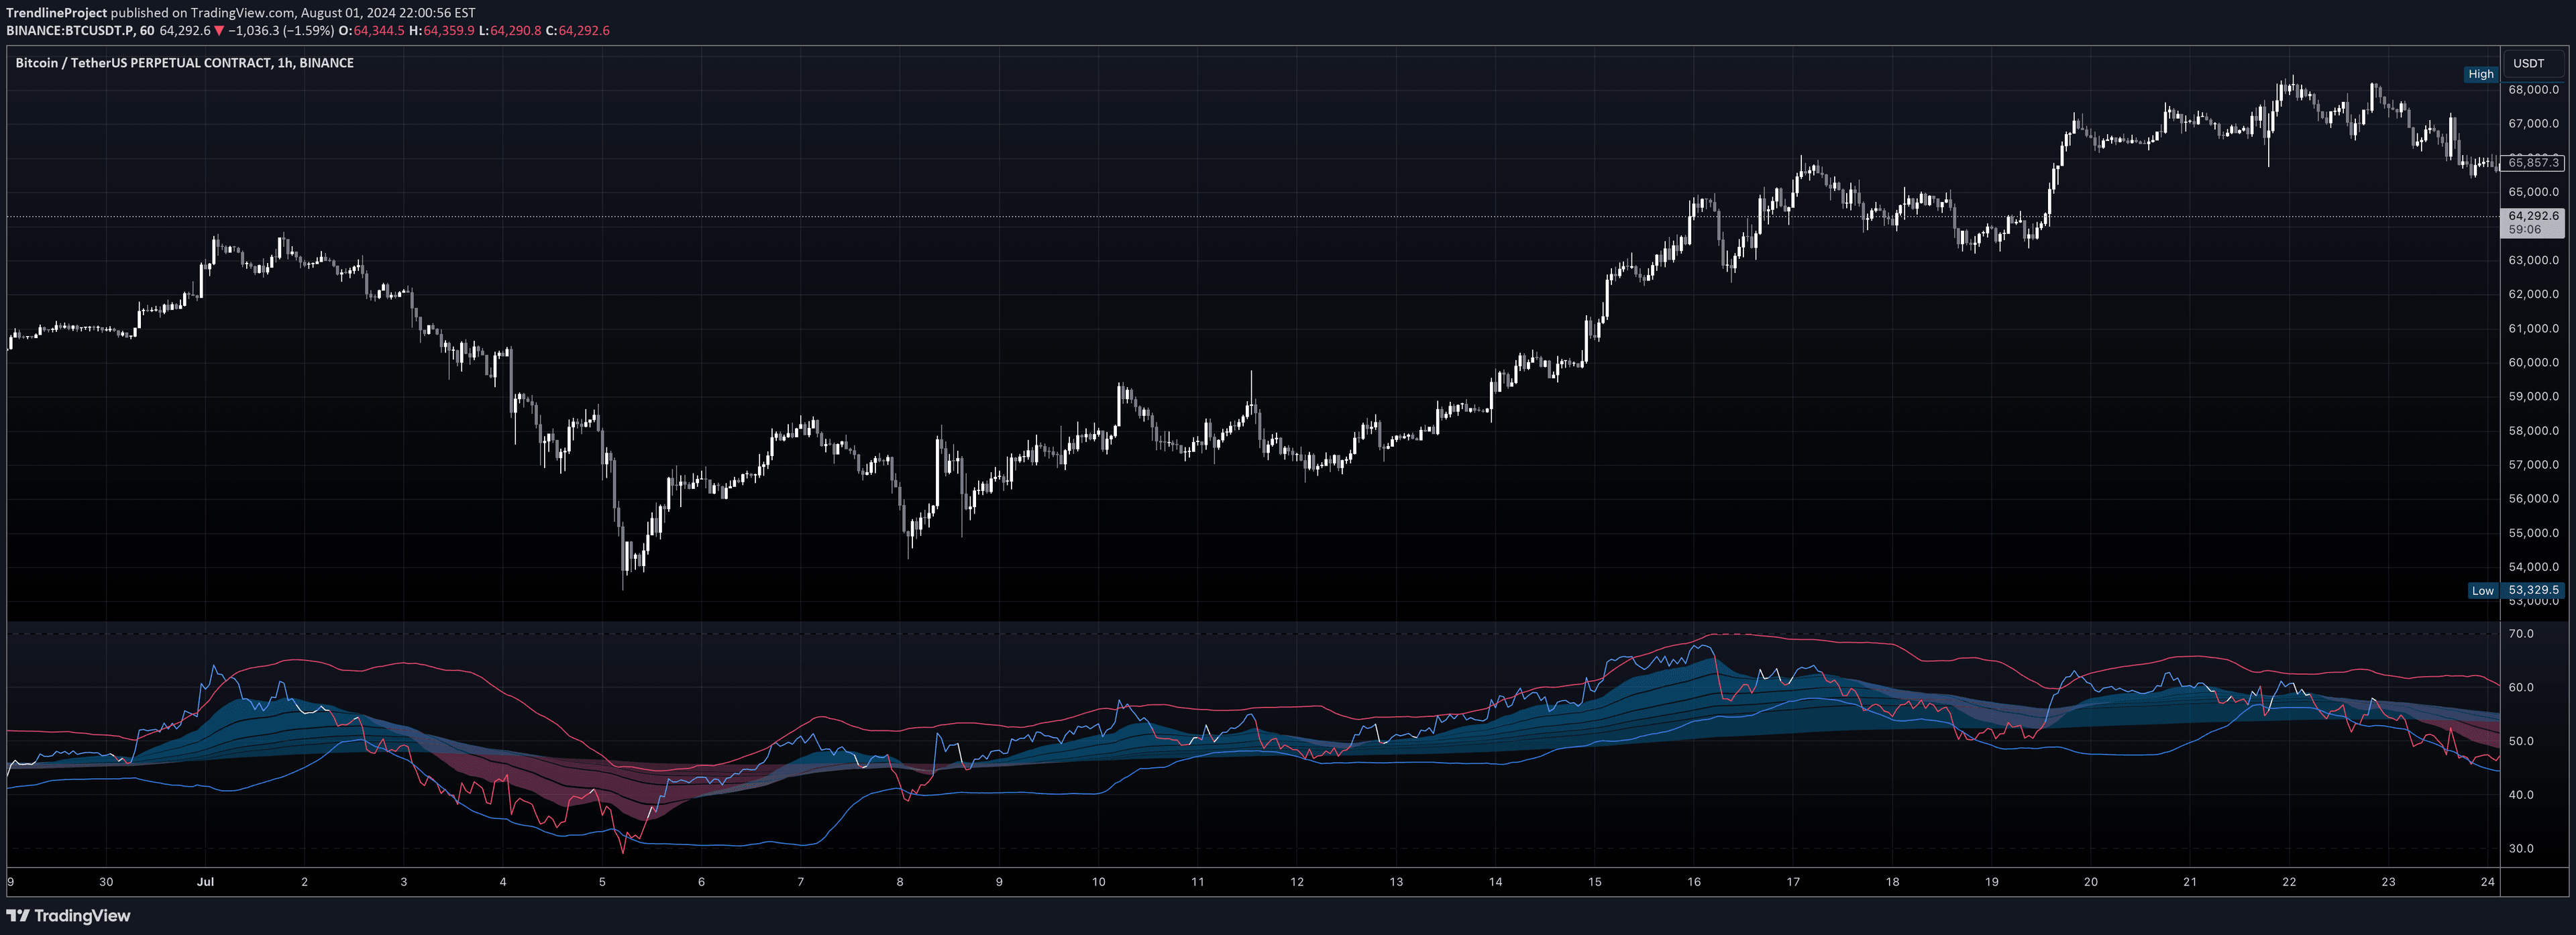
TP RSI is a comprehensive 3-in-1 technical analysis tool that combines EMA ribbon, RSI, and Bollinger Bands to provide integrated insights into market trend, momentum, and volatility.
Explore complementary indicator rolesHow it works
The TP RSI indicator operates by integrating three powerful technical analysis components: an EMA ribbon, RSI, and Bollinger Bands. The EMA ribbon consists of 10 exponential moving averages color-coded to represent trend direction, with blue indicating an uptrend and red signaling a downtrend. The RSI is color-coded to reflect momentum, with blue representing upward momentum, red showing downward momentum, and white indicating neutral conditions.
Bollinger Bands are applied to the RSI to provide dynamic overbought and oversold levels, with band width indicating market volatility. The indicator generates signals by analyzing the interaction between these components, such as a buy signal when the blue ribbon aligns with a blue RSI outside the ribbon, or a sell signal when the red ribbon matches a red RSI positioned outside the ribbon.
Why it may be useful
The TP RSI indicator offers traders a comprehensive and integrated approach to market analysis by simultaneously addressing three critical aspects of trading: trend, momentum, and volatility. By combining multiple technical indicators into a single, visually intuitive tool, traders can quickly assess market conditions without switching between different indicators. The color-coded system provides immediate visual cues about market dynamics, reducing the complexity of interpretation.
Moreover, the indicator's multi-factor confirmation approach enhances trading decision-making by requiring alignment across trend, momentum, and volatility dimensions. This holistic analysis helps traders identify more reliable trading opportunities and reduce the risk of false signals, making it a valuable tool for traders seeking a more nuanced and comprehensive market analysis strategy.
When to explore it
The TP RSI indicator is most effective in markets with clear trending characteristics, where price movements exhibit consistent directional momentum. It performs particularly well in markets experiencing moderate to high volatility, where the interaction between trend, momentum, and volatility components can provide meaningful insights. Traders can benefit from this indicator across various timeframes, from scalping to swing trading, making it a versatile tool for different trading styles.
The indicator is especially useful during market transitions, breakouts, and potential trend reversals. By analyzing the synergy between EMA ribbon, RSI, and Bollinger Bands, traders can identify potential entry and exit points with greater confidence. It is particularly valuable in markets with distinct trend patterns, such as stocks, forex, and cryptocurrency markets, where rapid shifts in momentum and volatility are common.
Keep exploring
What we’ve verified
Access, alerts and repainting behaviour have not been independently verified for this indicator. Check the creator’s current publication and settings.
General descriptions and classifications are recovered research. Verified details above identify the specific checks we have completed. Check the creator’s current publication for later changes.


