YOUR INDICATOR RESEARCH STARTS HERE

Find the right indicator.
Understand what it does.

Explore 11,183 indicators. Filter beyond the obvious.
Discover the tools that fit the way you trade.

THE INDICATOR LIBRARY

Results for “ribbon”

11,183 tools to explore

56 indicators matching your filters
Save search
Trend

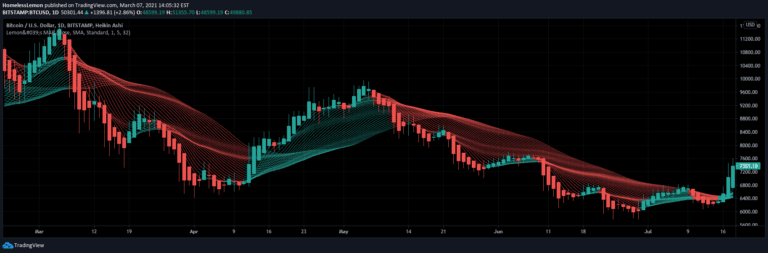
Customizable MA Ribbon

by HomelessLemon

A customizable moving average ribbon indicator that helps traders analyze trend strength and direction by plotting multiple moving averages with adjustable parameters and visual themes.

Main price chart · unverifiedDay Trading · Swing Trading
Explore
2.6Klikes37.9Kviews12comments
Save
MomentumOscillatorTrend

Double Ribbon [ChartPrime]

by ChartPrime

The Double Ribbon indicator combines two Simple Moving Average ribbons to assess market trends and momentum, providing a visual and quantitative analysis of market direction and strength.

Separate pane · unverifiedScalping · Day Trading
Explore
1.8Klikes26.1Kviews7comments
Save
LevelsMomentumTrend

Levels Strength Index [BigBeluga]

by BigBeluga

A dynamic indicator that analyzes price positioning against levels, providing probability-based insights into market momentum and strength through color-coded visualizations.

Main price chart · unverifiedScalping · Day Trading
Explore
1.5Klikes29.5Kviews26comments
Save
MomentumOscillatorSignal

MACD Normalized [ChartPrime]

by ChartPrime

A normalized MACD indicator that combines moving average convergence divergence with stochastic principles to provide flexible market trend analysis and trading signals.

Separate pane · unverifiedScalping · Day Trading
Explore
1Klikes23.7Kviews2comments
Save
MomentumOscillatorTrend

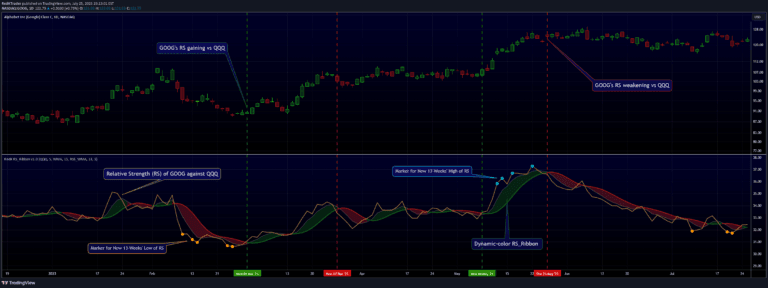
WaveTrend Ribbon [AlgoAlpha]

by AlgoAlpha

WaveTrend Ribbon is an advanced TradingView indicator that combines WaveTrend oscillator with Z-score analysis to generate precise trading signals and market trend insights.

Separate pane · unverifiedScalping · Day Trading
Explore
950likes22.9Kviews5comments
Save
TrendMomentumVolatility

TP RSI

by TrendlineProject

TP RSI is a comprehensive 3-in-1 technical analysis tool that combines EMA ribbon, RSI, and Bollinger Bands to provide integrated insights into market trend, momentum, and volatility.

Separate pane · unverifiedScalping · Day Trading
Explore
639likes10.5Kviews9comments
Save
MomentumSignalTrend

Uptrick: Time Based Reversion

by Uptrick

A dynamic trend indicator that uses moving averages and streak analysis to identify market momentum, potential reversals, and provide visual trend insights across multiple price data points.

Main price chart · unverifiedScalping · Day Trading
Explore
596likes8.4Kviews4comments
Save
SignalTrend

Johnny's Moving Average Ribbon

by JonathanLeyva

A moving average ribbon indicator that uses color-coded lines to visualize market trends and potential trade entry points across different timeframes and moving average types.

Main price chart · unverifiedScalping · Day Trading
Explore
531likes8.3Kviews0comments
Save

Likes, views, and comments are historical TradingView snapshots. They describe attention, not trading performance.

START WITH A QUESTION

A little less searching.
A lot more understanding.

Tell DeepAlpha what you need. Get an explanation, a shortlist,
and a direct path to the indicators behind it.

Ask DeepAlpha