Johnny's Trend Lines, Supports and Resistances
Advanced trend line and support/resistance indicator that dynamically identifies market trends, key price levels, and potential reversal points using customizable technical analysis parameters.
Explore 11,183 indicators. Filter beyond the obvious.
Discover the tools that fit the way you trade.
11,183 tools to explore
Advanced trend line and support/resistance indicator that dynamically identifies market trends, key price levels, and potential reversal points using customizable technical analysis parameters.
A moving average ribbon indicator that uses color-coded lines to visualize market trends and potential trade entry points across different timeframes and moving average types.
A dynamic trend identification indicator that uses volatility, momentum, and impulse filtering to detect high-probability market trend shifts and reversals with adaptive signal confirmation.
An adaptive machine learning-inspired moving average that dynamically adjusts to market conditions using multiple trend indicators like ADX, RSI, and volatility bands.
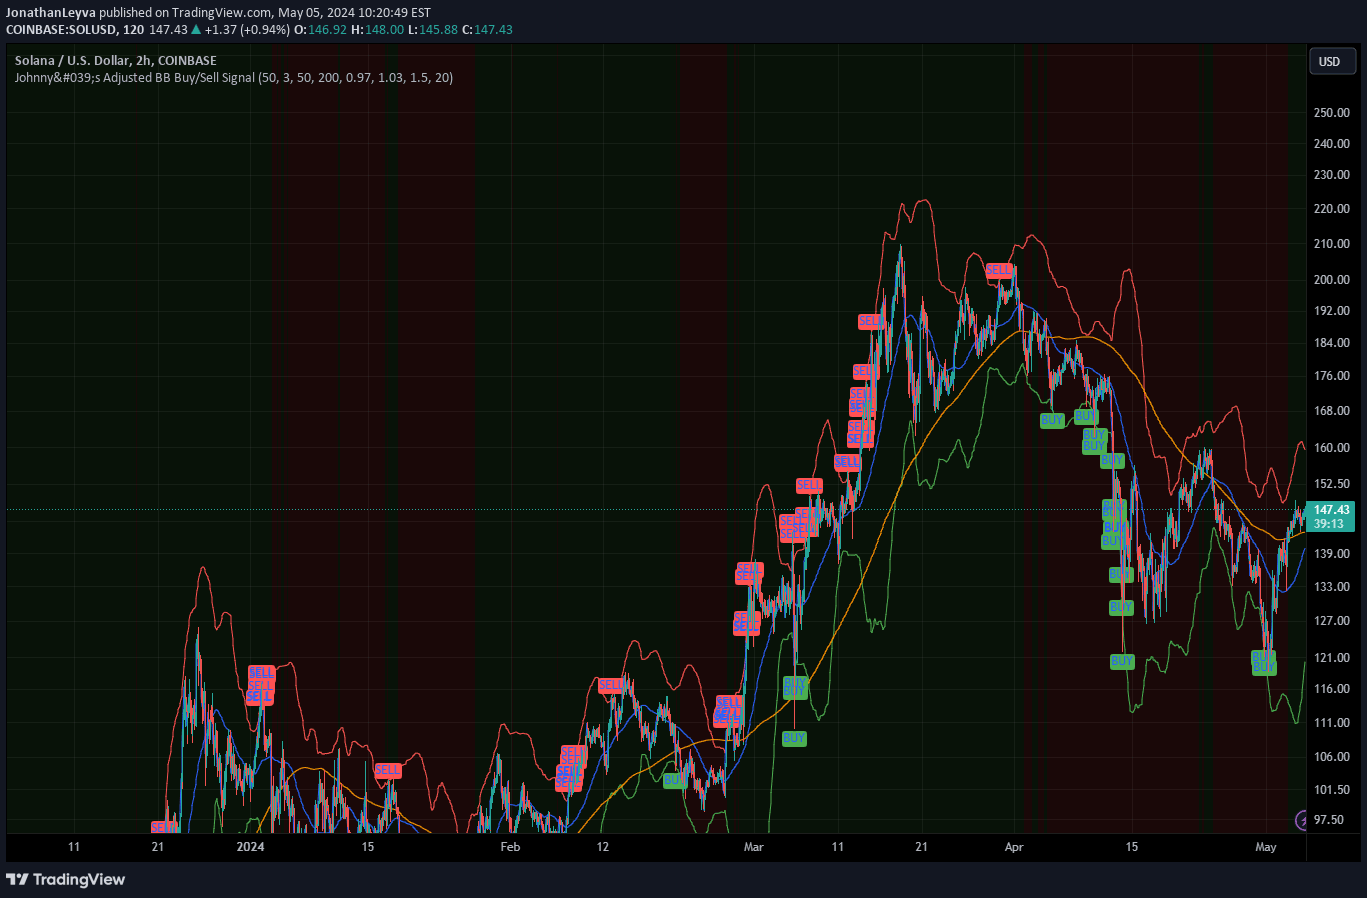
A dynamic trading signal using Bollinger Bands and moving averages to identify strategic entry and exit points by analyzing market volatility and trend conditions.
Likes, views, and comments are historical TradingView snapshots. They describe attention, not trading performance.