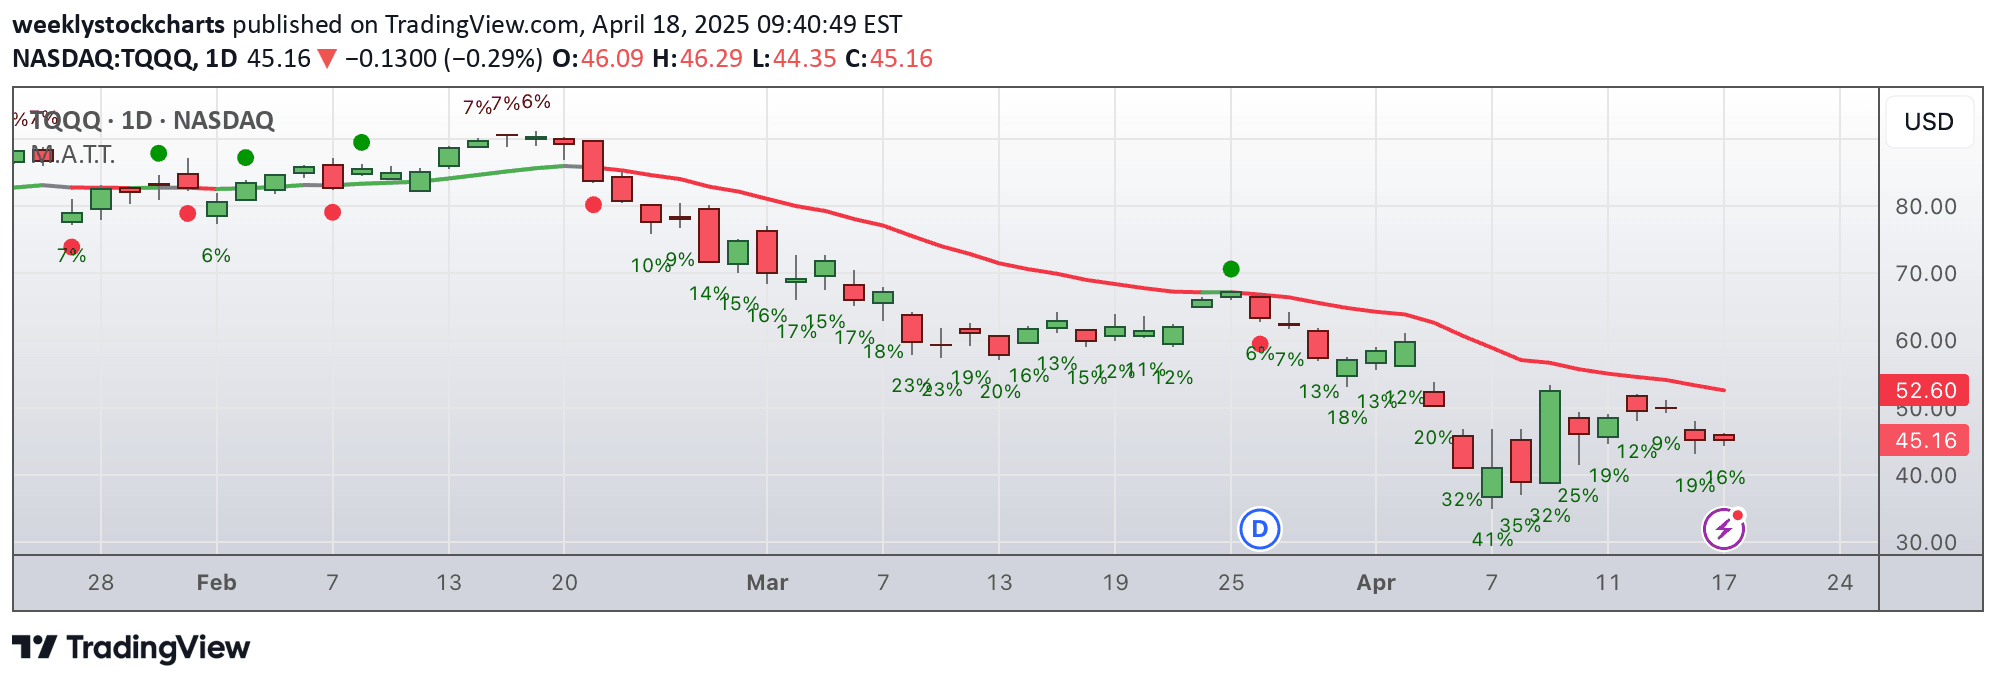
A moving average ribbon indicator that uses color-coded lines to visualize market trends and potential trade entry points across different timeframes and moving average types.
Explore complementary indicator rolesHow it works
The moving average ribbon works by plotting multiple moving averages of different lengths simultaneously on a price chart. Traders can choose between exponential (EMA) and simple moving averages (SMA) to create a visual representation of market trends. Each moving average line is dynamically color-coded based on its direction and position relative to a reference moving average.
The color coding provides instant visual insights into market momentum and trend strength. Lime green indicates an uptrend with potential long positions, maroon suggests caution for long positions, ruby red represents a downtrend suitable for short positions, and green signals potential reentry points or trend reversal warnings.
Why it may be useful
The moving average ribbon is crucial for traders because it simplifies complex market trend analysis into an easy-to-understand visual format. By using multiple moving averages with different time periods, traders can quickly assess overall market sentiment and identify potential trend changes. The color-coded system allows for rapid interpretation of market dynamics without extensive technical analysis.
Moreover, the indicator provides flexible customization options, enabling traders to adapt the tool to their specific trading style and preferences. Its ability to show trend strength, direction, and potential entry/exit points makes it a versatile tool for traders across different markets and timeframes.
When to explore it
The moving average ribbon works best in trending markets with clear directional movements, where price is consistently moving up or down. It is particularly effective in markets with moderate to high volatility, where trend identification can provide significant trading advantages. Traders should use this indicator when they want to quickly assess market momentum and potential trade opportunities.
The ribbon is most reliable when combined with other technical indicators and fundamental analysis. It performs exceptionally well in liquid markets like forex, stocks, and major cryptocurrency pairs. Traders should be cautious during periods of extreme market uncertainty or range-bound conditions where trend signals might be less reliable.
Keep exploring
What we’ve verified
Access, alerts and repainting behaviour have not been independently verified for this indicator. Check the creator’s current publication and settings.
General descriptions and classifications are recovered research. Verified details above identify the specific checks we have completed. Check the creator’s current publication for later changes.