YOUR INDICATOR RESEARCH STARTS HERE

Find the right indicator.
Understand what it does.

Explore 11,183 indicators. Filter beyond the obvious.
Discover the tools that fit the way you trade.

THE INDICATOR LIBRARY

Results for “gridbot”

11,183 tools to explore

7 indicators matching your filters
Save search
TrendVolatilityEditor’s pick

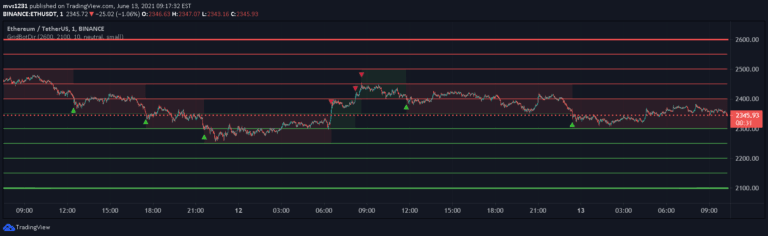
Grid Bot Simulator

by xxattaxx

A grid trading bot simulator that divides price ranges into zones, generating trading signals based on price movement in ranging and trending markets with customizable grid settings.

Main price chart · unverifiedDay Trading · Swing Trading
Explore
5Klikes105.4Kviews87comments
Save
SignalTrend

GRIDBOT Scalper by nnam

by nnamdert

A price action-based indicator designed for GridBots that identifies potential market reversals after sustained price movements, helping traders recognize entry points for short or long trades.

Main price chart · unverifiedScalping · Day Trading
Explore
1.5Klikes30.3Kviews26comments
Save
TrendSignalLevels

Grid Bot Parabolic [xxattaxx]

by xxattaxx

Dynamic grid trading indicator that uses parabolic curves to create adaptive support and resistance levels across different market conditions and trends.

Main price chart · unverifiedScalping · Day Trading
Explore
821likes13.8Kviews9comments
Save
LevelsSignal

Simple Grid Lines Visualizer

by lecjacks

A trading bot strategy that creates predefined buy and sell orders within a specific price range, aiming to profit from price oscillations in sideways markets.

Main price chart · unverifiedScalping · Day Trading
Explore
448likes10.2Kviews3comments
Save
SignalLevels

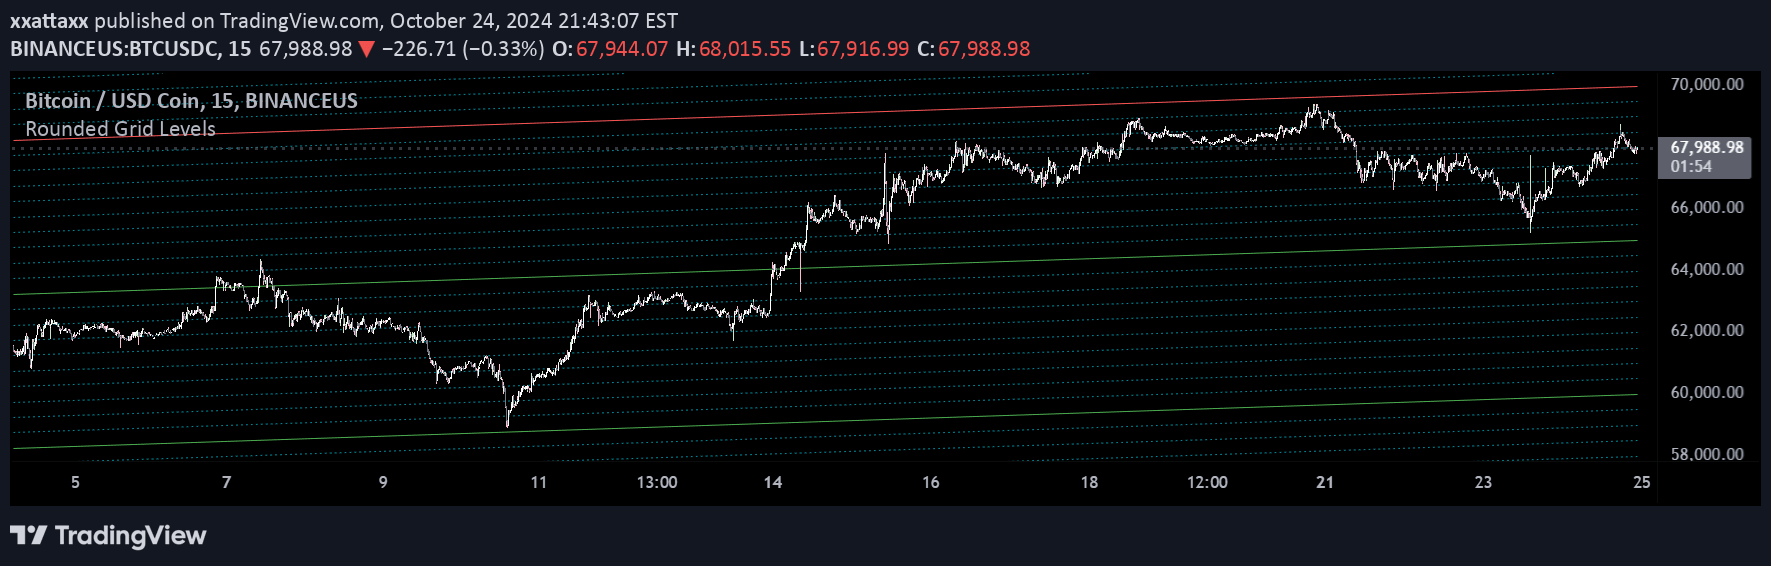
Rounded Grid Levels

by xxattaxx

A visual tool that dynamically highlights key psychological round number price levels on charts, helping traders identify potential support, resistance, and market sentiment zones.

Main price chart · unverifiedScalping · Day Trading
Explore
231likes3.7Kviews5comments
Save
OscillatorVolatility

Average True Range Percent

by rex_wolfe

Average True Range Percent (ATRP) is a volatility indicator that measures price range as a percentage, allowing comparison of volatility across different financial instruments.

Separate pane · unverifiedScalping · Day Trading
Explore
66likes3.1Kviews0comments
Save

Likes, views, and comments are historical TradingView snapshots. They describe attention, not trading performance.

START WITH A QUESTION

A little less searching.
A lot more understanding.

Tell DeepAlpha what you need. Get an explanation, a shortlist,
and a direct path to the indicators behind it.

Ask DeepAlpha