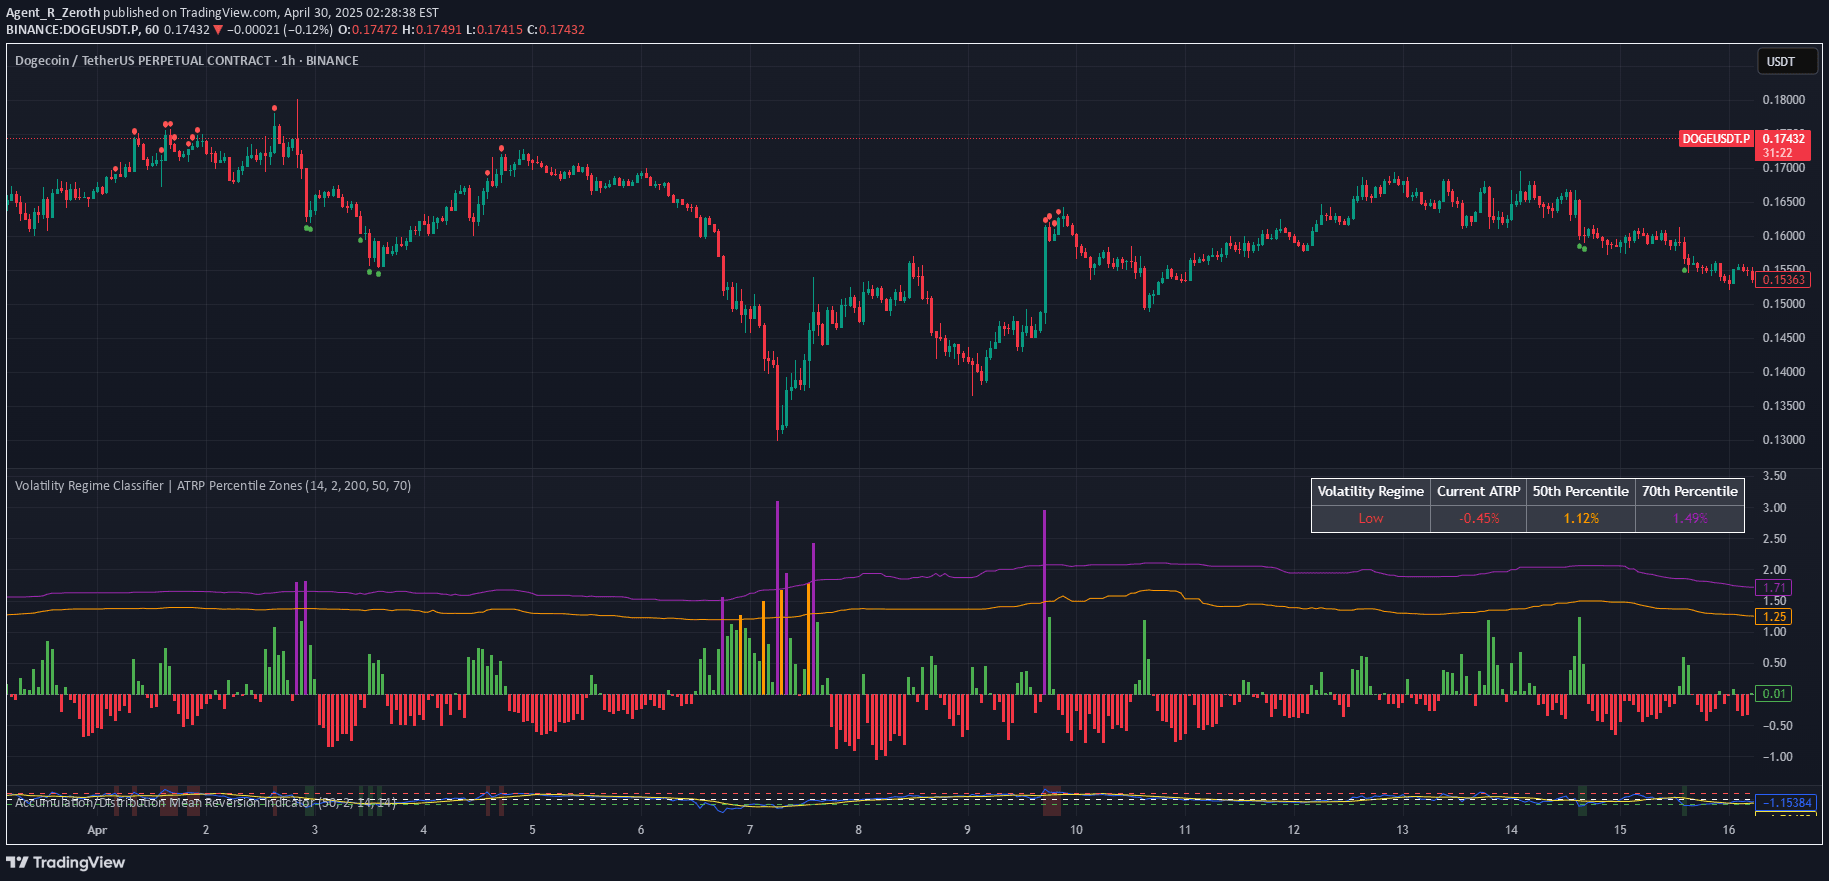
Average True Range Percent (ATRP) is a volatility indicator that measures price range as a percentage, allowing comparison of volatility across different financial instruments.
Explore complementary indicator rolesHow it works
The Average True Range Percent (ATRP) calculates volatility by converting the true range into a percentage relative to the average price of the period. It starts by determining the true range, which is the maximum of three values: the current period's high minus low, the absolute value of the current high minus the previous close, and the absolute value of the current low minus the previous close.
After calculating the true range, ATRP divides this value by the average price of the current period ((high + low) / 2) and expresses it as a percentage. This percentage is then smoothed using a moving average to create a more stable representation of volatility that can be consistently compared across different financial instruments.
Why it may be useful
The ATRP provides traders with a standardized measure of volatility that overcomes the limitations of traditional Average True Range (ATR) indicators. By converting the true range to a percentage, it allows for meaningful comparisons between different financial instruments, regardless of their price levels or absolute price ranges.
This normalized approach helps traders assess market volatility more objectively, enabling better risk management and more informed trading decisions. Traders can use ATRP to identify periods of increased or decreased market volatility, adjust their trading strategies accordingly, and set more precise stop-loss and take-profit levels.
When to explore it
The ATRP is most effective when traders want to compare volatility across different markets, instruments, or timeframes. It is particularly useful during periods of market transition, such as when entering or exiting trending markets, or when assessing potential breakout or breakdown scenarios.
Traders should use ATRP in conjunction with other technical indicators to confirm volatility signals and make more comprehensive trading decisions. It is especially valuable for developing adaptive trading strategies that can adjust to changing market conditions and volatility levels across various financial instruments.
Keep exploring
What we’ve verified
Access, alerts and repainting behaviour have not been independently verified for this indicator. Check the creator’s current publication and settings.
General descriptions and classifications are recovered research. Verified details above identify the specific checks we have completed. Check the creator’s current publication for later changes.