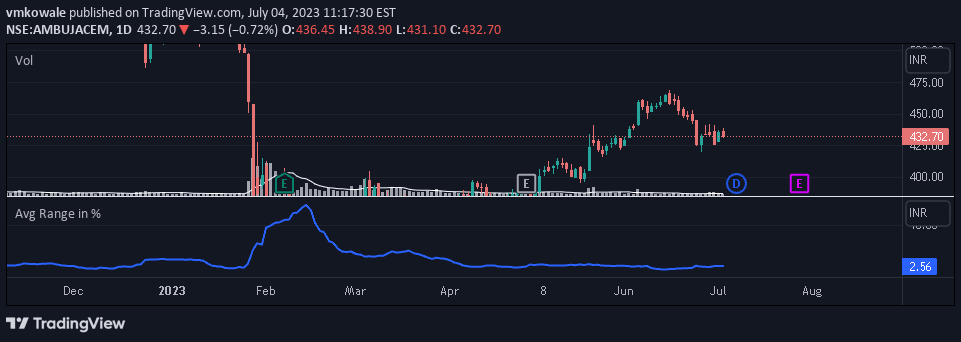
A normalized Average True Range (ATR) indicator that uses color-coded columns to represent different volatility levels, helping traders identify market conditions and potential trading strategies.
Explore complementary indicator rolesHow it works
The indicator calculates normalized ATR by dividing the current True Range by the Average True Range, creating a standardized measure of market volatility. This process allows traders to compare volatility across different financial instruments and timeframes with a consistent metric.
By presenting the normalized ATR through color-coded columns, the indicator provides a visual representation of market volatility levels. Traders can quickly interpret these levels, which are segmented into distinct ranges: below 1 (low volatility), between 1-3 (moderate volatility), and above 3 (high volatility).
Why it may be useful
Understanding market volatility is crucial for developing effective trading strategies and managing risk. The normalized ATR helps traders make more informed decisions by providing a clear, standardized view of market conditions, allowing them to adapt their approach based on current volatility levels.
By offering insights into potential market behavior, this indicator enables traders to select appropriate strategies such as inside bar, pullback, or breakout techniques. It also serves as a valuable tool for risk management, helping traders recognize when market conditions might be less favorable for certain trading approaches.
When to explore it
The normalized ATR is most effective when traders want to assess market volatility across different timeframes and financial instruments. It is particularly useful during periods of changing market conditions, helping traders identify shifts in volatility that might impact their trading strategies.
Traders can leverage this indicator during trending and ranging markets to make more precise entry and exit decisions. By understanding the volatility context, traders can better select appropriate strategies, such as mean reversion or breakout techniques, and adjust their risk management approaches accordingly.
Keep exploring
What we’ve verified
Access, alerts and repainting behaviour have not been independently verified for this indicator. Check the creator’s current publication and settings.
General descriptions and classifications are recovered research. Verified details above identify the specific checks we have completed. Check the creator’s current publication for later changes.