
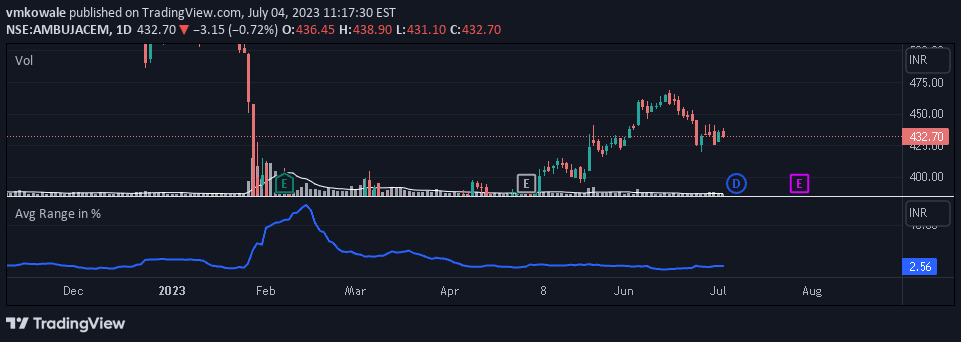
An indicator that calculates the average percentage range of stock/index price over N days, helping traders identify highly moving stocks for intraday trading strategies.
Explore complementary indicator rolesHow it works
The Average Percent Range indicator works by measuring the price movement from high to low over a specified number of days, calculating the percentage difference between these points. It aggregates these percentage ranges to provide a comprehensive view of a stock's price volatility and potential intraday movement.
Traders input the number of days they want to analyze, and the indicator computes the average percentage range across that period. This helps identify stocks with consistent or increasing price fluctuations, which can signal potential trading opportunities for quick, responsive trading strategies.
Why it may be useful
The Average Percent Range indicator is crucial for traders seeking to understand price volatility and potential intraday movement patterns. By quantifying the percentage range of price action, it provides a clear, numeric representation of a stock's dynamic behavior, helping traders make more informed decisions about potential entry and exit points.
This indicator is particularly valuable for short-term traders who rely on price movement and volatility to generate profits. It allows traders to quickly assess which stocks are most likely to provide significant price fluctuations, enabling more strategic and targeted trading approaches.
When to explore it
The Average Percent Range indicator is most effective during periods of active market trading, particularly for intraday and scalping strategies. It works best in markets with high liquidity and significant price movements, such as during earnings announcements, economic reports, or other events that can trigger substantial stock price changes.
Traders should use this indicator when they want to quickly identify stocks with the highest potential for short-term price movements. It is especially useful for day traders and scalpers who seek to capitalize on rapid price fluctuations and need a quick, reliable method of screening potential trading opportunities.
Keep exploring
What we’ve verified
Access, alerts and repainting behaviour have not been independently verified for this indicator. Check the creator’s current publication and settings.
General descriptions and classifications are recovered research. Verified details above identify the specific checks we have completed. Check the creator’s current publication for later changes.


