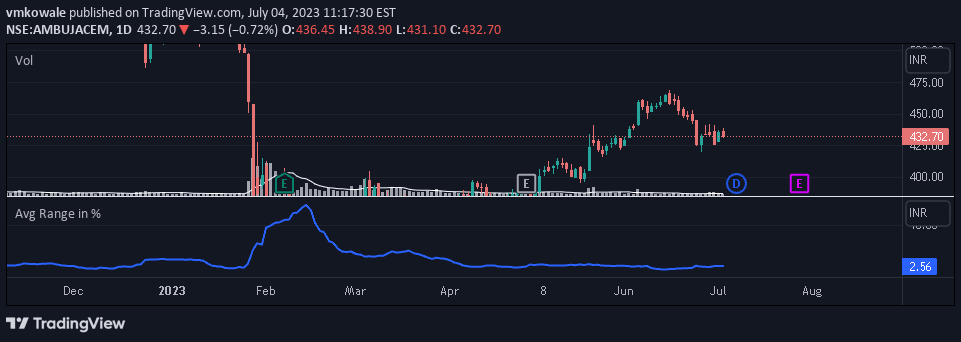
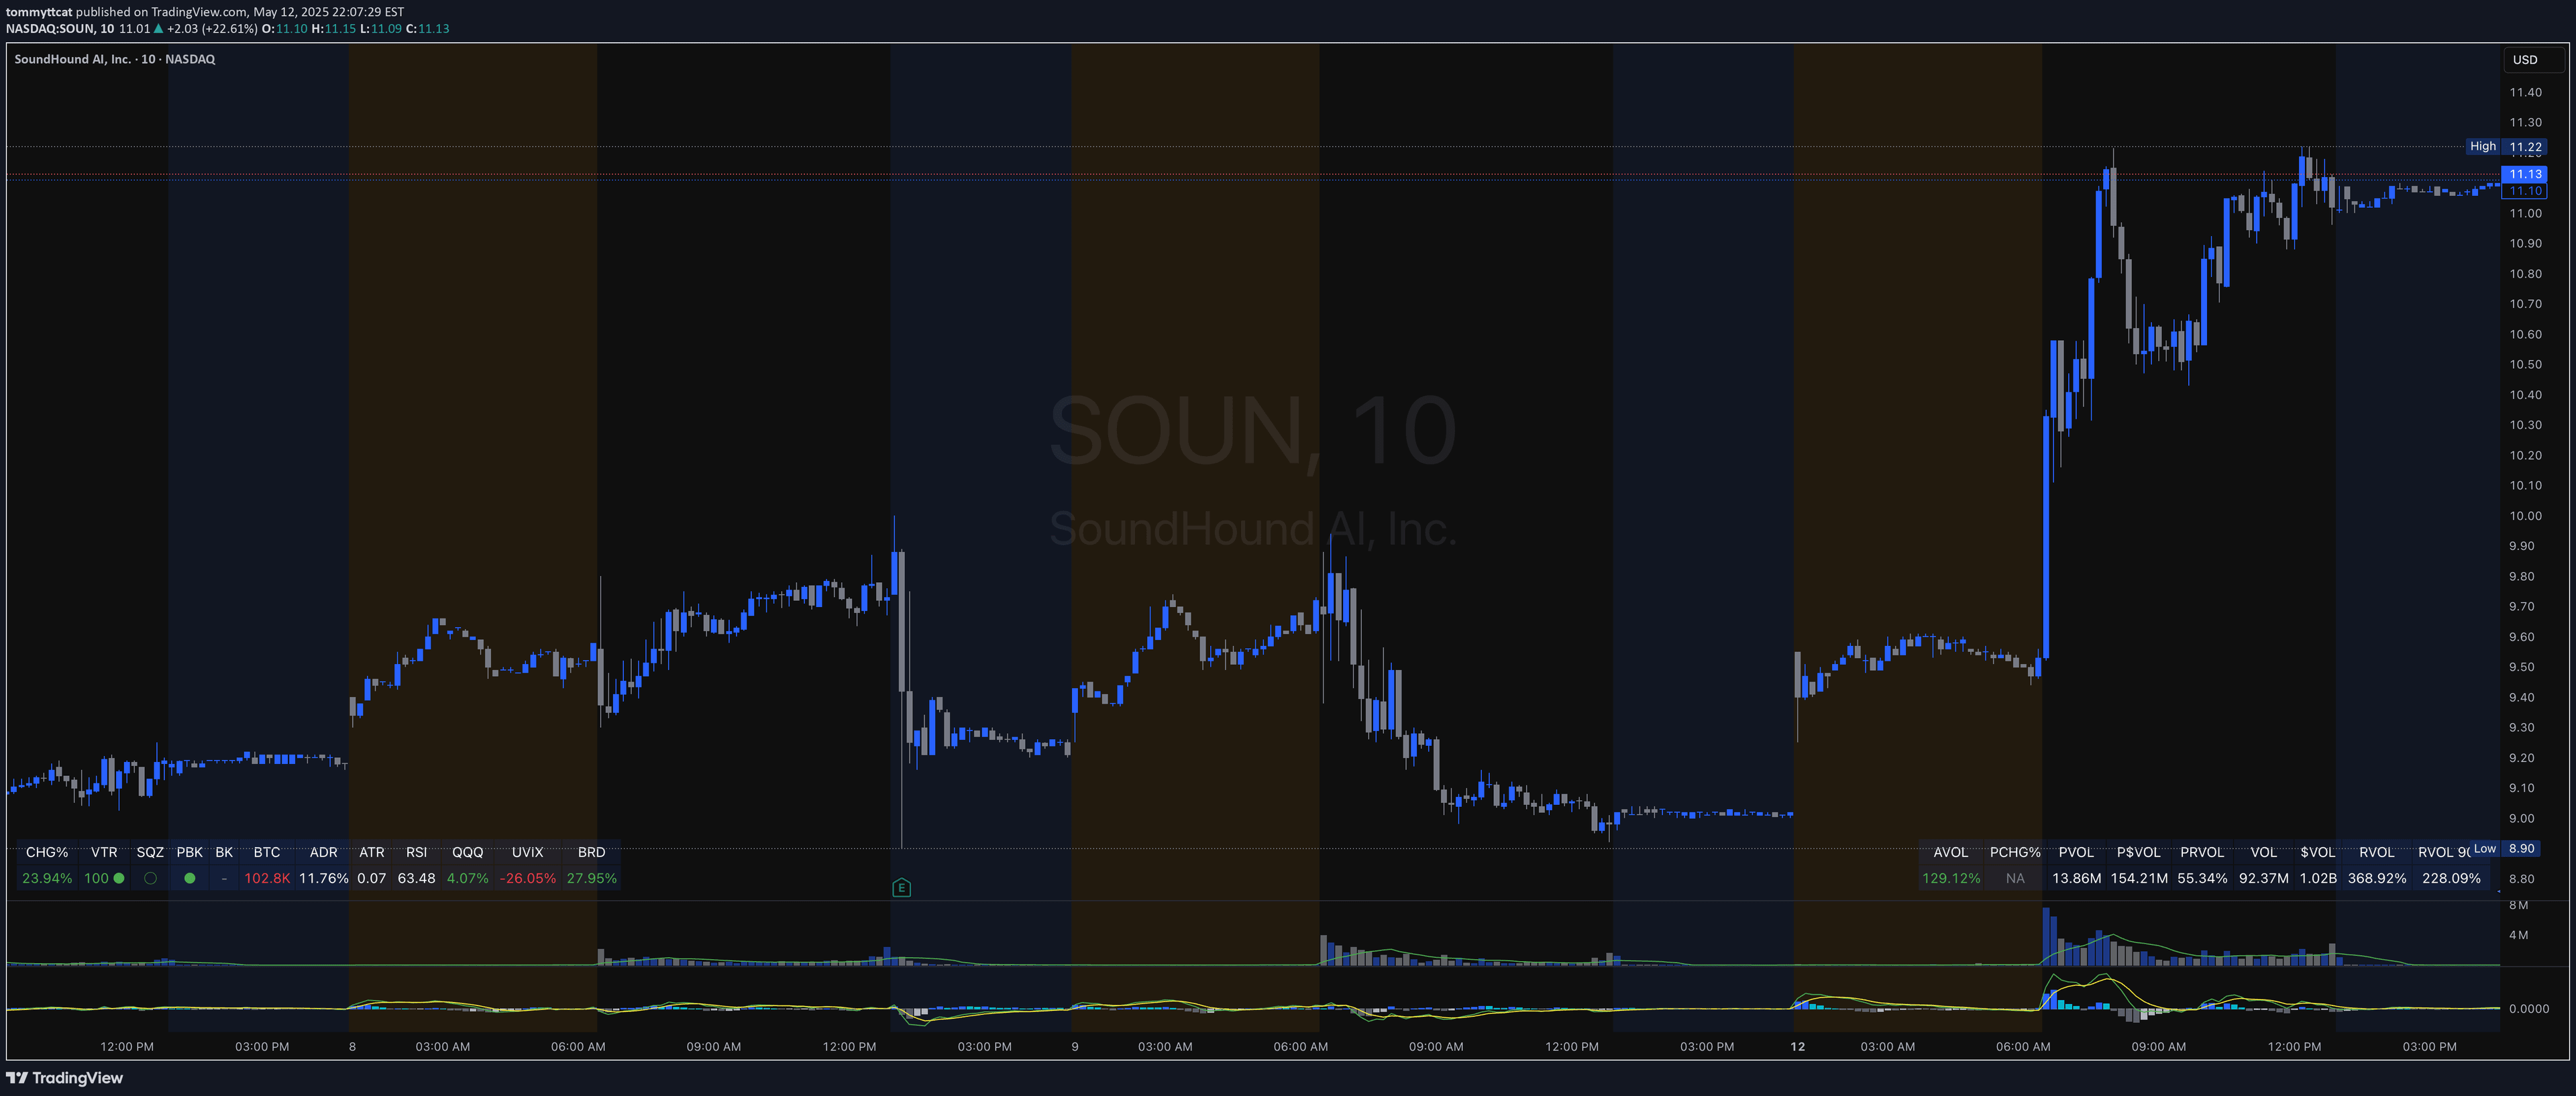
A volatility indicator measuring price range percentage across multiple time zones, helping traders identify potential low volatility periods and potential trend beginnings.
Explore complementary indicator rolesHow it works
The Percentage Range Consolidation histogram analyzes price volatility by calculating range percentages across three configurable time zones: 10, 30, and 50 periods. It measures the price range from highest to lowest close and ranks these percentages using a percentile nearest rank formula.
The indicator uses a configurable 'percentage zone PNR Length' to compare current zone percentages against historical data. When the histogram falls below a specified threshold (default 20%), it colors the histogram to indicate low volatility zones, with different colors representing different time periods.
Why it may be useful
This indicator helps traders identify potential market consolidation and impending trend movements by revealing periods of low price volatility. By highlighting zones with compressed price ranges, it can signal potential breakout opportunities and help traders prepare for significant price movements.
The multi-zone approach allows traders to assess volatility across different timeframes, providing a comprehensive view of market conditions. The flexible settings enable customization to suit individual trading strategies and market preferences.
When to explore it
The Percentage Range Consolidation indicator is most effective during periods of market consolidation or when looking for potential trend reversal points. It works best in markets with clear trending characteristics and can be particularly useful in identifying low volatility zones that often precede significant price moves.
Traders should use this indicator in conjunction with other technical analysis tools to confirm signals and reduce false positives. It is particularly valuable for traders seeking to anticipate potential breakout opportunities across various timeframes and market conditions.
Keep exploring
What we’ve verified
Access, alerts and repainting behaviour have not been independently verified for this indicator. Check the creator’s current publication and settings.
General descriptions and classifications are recovered research. Verified details above identify the specific checks we have completed. Check the creator’s current publication for later changes.