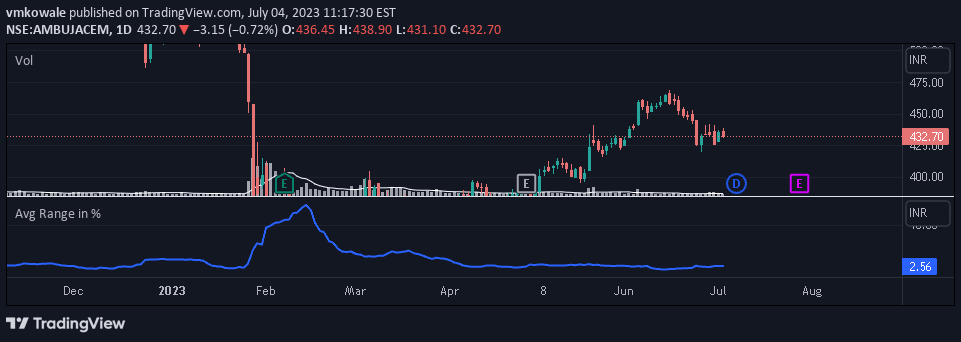
ADR % Ranges
An indicator that calculates average daily range percentages to help traders identify price movement boundaries and potential trading targets based on historical price performance.
Explore 11,183 indicators. Filter beyond the obvious.
Discover the tools that fit the way you trade.
11,183 tools to explore
An indicator that calculates average daily range percentages to help traders identify price movement boundaries and potential trading targets based on historical price performance.
An Average Daily Range (ADR) indicator that tracks price movement beyond daily range levels, providing insights into historical price behavior and statistical analysis of market volatility.
The Average Session Range (ASR) indicator calculates session volatility and plots dynamic support and resistance levels based on price range quartiles for precise trading insights.
A daily range projection tool tracking session highs and lows to calculate potential market movement boundaries using average daily range analysis.
An indicator that calculates the average percentage range of stock/index price over N days, helping traders identify highly moving stocks for intraday trading strategies.
ADR Signal is a technical indicator that measures daily price range and helps traders identify potential intraday reversals and manage trading risk by tracking average price movement.
Likes, views, and comments are historical TradingView snapshots. They describe attention, not trading performance.