Order Block Finder (Experimental)
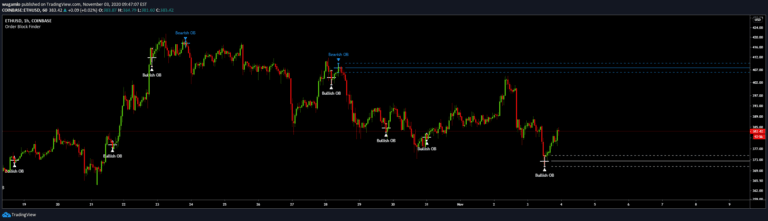
An indicator identifying institutional order blocks by detecting significant price zones where potential trend reversals or continuations might occur based on sequential candle patterns.
Explore 11,183 indicators. Filter beyond the obvious.
Discover the tools that fit the way you trade.
11,183 tools to explore
An indicator identifying institutional order blocks by detecting significant price zones where potential trend reversals or continuations might occur based on sequential candle patterns.
Breakout Probability indicator calculates the likelihood of new market highs or lows by analyzing historical price action and displaying percentage probabilities for potential price levels.
A Volume Profile indicator that calculates trading volumes within a fixed range, helping traders understand volume distribution and identifying key price levels with visual representation.
A volume-based indicator that identifies supply and demand zones on a chart, revealing potential support and resistance levels using precise volume and price analysis.
An advanced trading strategy measuring the opening range of a trading session to identify potential breakout opportunities and determine market trend direction with precise entry and exit points.
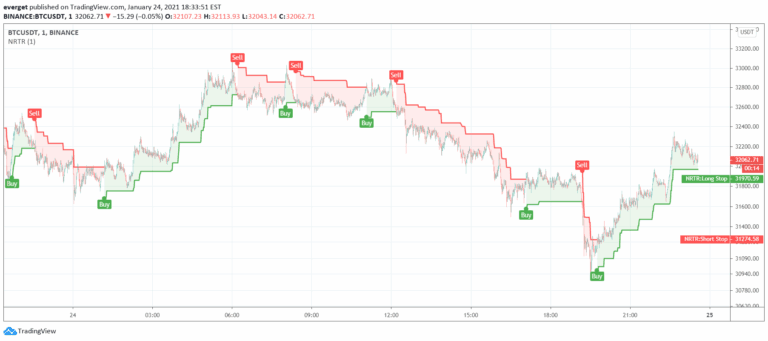
Nick Rypock Trend Reversal (NRTR) is a dynamic price channel indicator that tracks trend direction by measuring price extremes and percentage deviation from peak or bottom.
A technical analysis script that identifies cup-like price formations by creating channels and tracking potential breakout points in financial markets using specific bar search and channel width parameters.
A customizable market session tracker displaying trading hours for Tokyo, London, New York, and Sydney with multiple visualization options and advanced trading insights.
A volume profile charting tool that visualizes trading volume distribution across price levels, detecting significant volume nodes and clusters for strategic trading insights.
Renko Candles Overlay is a charting technique that transforms price action into uniform-sized bricks, offering a simplified visual representation of market trends and price movements.
An advanced stop-loss strategy that uses volume, price, and volatility to dynamically adjust stop-loss levels, helping traders manage risk by considering individual security characteristics.
A comprehensive zigzag indicator featuring multiple calculation methods for identifying trend changes and price reversals across different market conditions and trading styles.
Likes, views, and comments are historical TradingView snapshots. They describe attention, not trading performance.