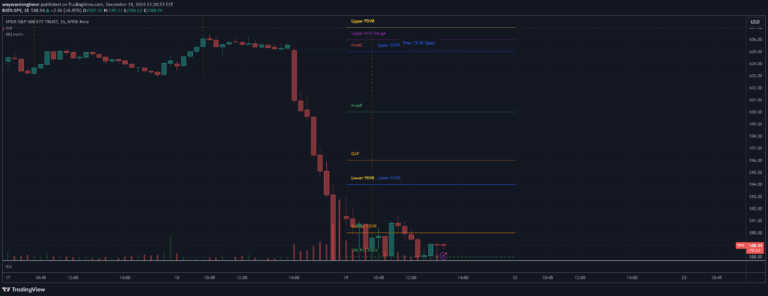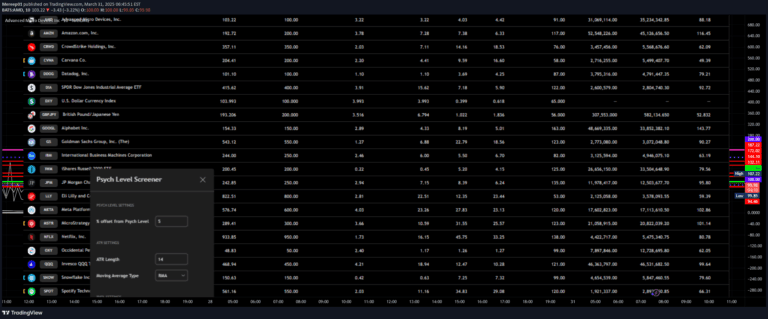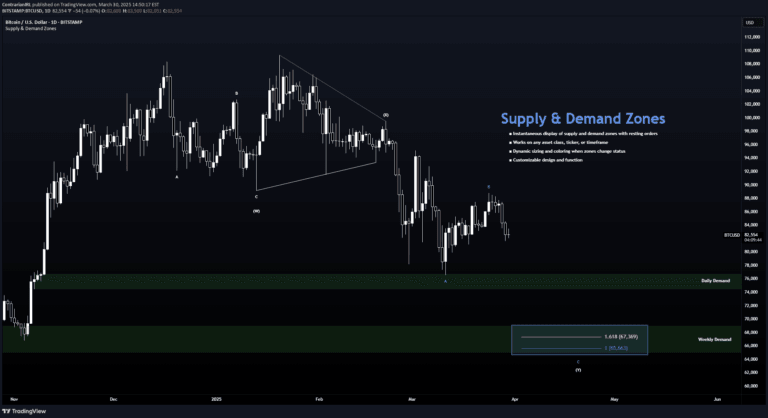
A visual tool that dynamically highlights key psychological round number price levels on charts, helping traders identify potential support, resistance, and market sentiment zones.
Explore complementary indicator rolesHow it works
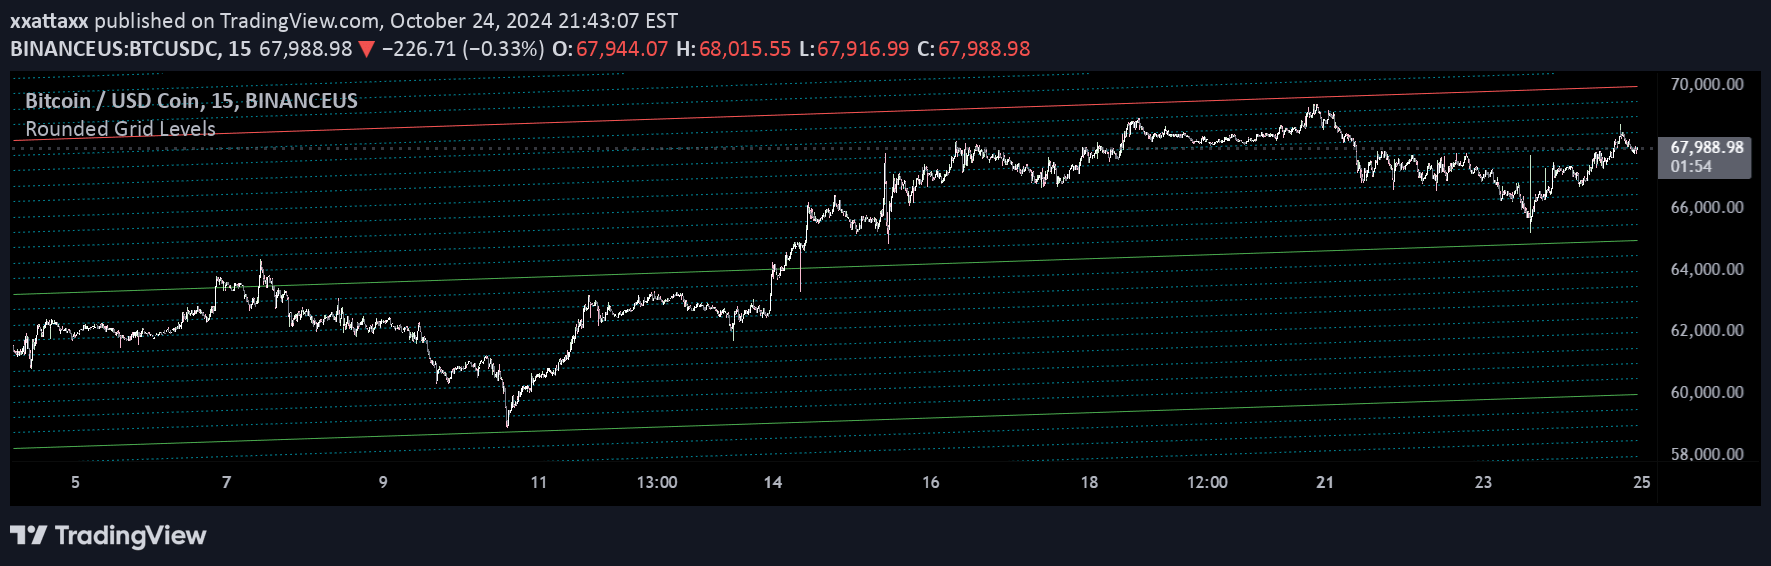
The Rounded Grid Levels indicator creates dynamic gridlines that represent significant round number price levels based on user-defined settings. It calculates these levels by using a configurable rounding step that determines the spacing between gridlines, which can be horizontal, tilted, or fan-shaped depending on selected parameters.
The indicator adapts to the current chart view, scaling gridlines according to the visible price range and adjusting their direction based on market trends. Users can customize the visualization through settings like rounding step, major grid intervals, and grid type, allowing for a personalized approach to identifying psychological price levels.
Why it may be useful
Round numbers play a crucial psychological role in financial markets, influencing trader behavior and decision-making processes. These levels often act as focal points where market participants cluster orders, create support or resistance, and react to significant price milestones, making them important for understanding market sentiment.
By visualizing these key levels, traders can gain insights into potential price reactions, order clustering, and market psychology. The indicator helps traders identify areas where price might pause, reverse, or gain momentum, providing a valuable framework for analyzing market dynamics without generating direct trading signals.
When to explore it
The Rounded Grid Levels indicator is most effective in markets with clear psychological price levels and significant round number interactions. It works well across various asset classes, including cryptocurrencies, stocks, forex, and commodities, providing value in both trending and ranging market conditions.
Traders can utilize this tool most effectively when seeking to understand potential support and resistance zones, analyze market sentiment, and gain a broader perspective on price action. It is particularly useful for traders who want to visualize key psychological levels without relying on predictive signals, offering a flexible and customizable approach to market analysis.
Keep exploring
What we’ve verified
Access, alerts and repainting behaviour have not been independently verified for this indicator. Check the creator’s current publication and settings.
General descriptions and classifications are recovered research. Verified details above identify the specific checks we have completed. Check the creator’s current publication for later changes.